Structural Analysis
6th Edition
ISBN: 9781337630931
Author: KASSIMALI, Aslam.
Publisher: Cengage,
expand_more
expand_more
format_list_bulleted
Question
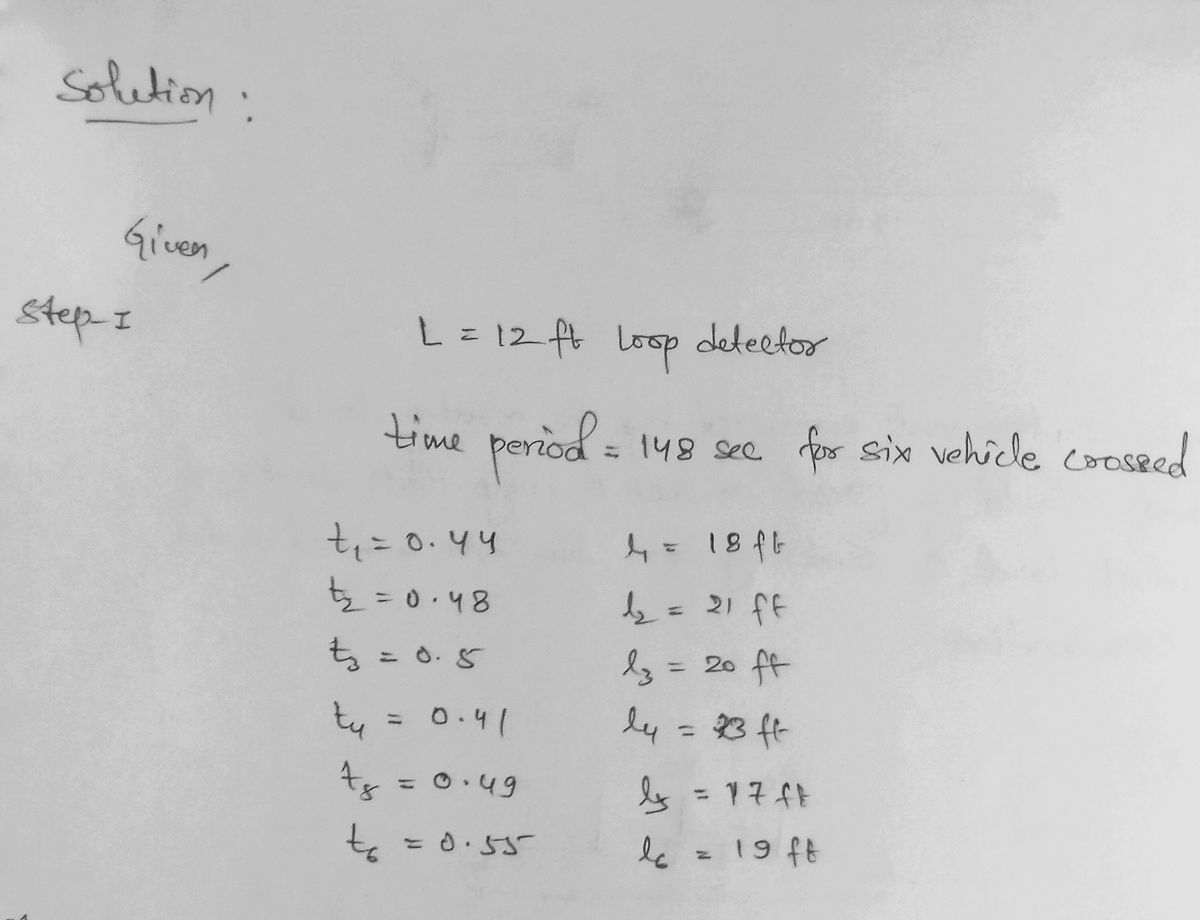
A 12 ft long loop detector has observed six vehicles that have crossed the device in a 148 second period, for the following durations: 0.44; 0.48; 0.5; 0.41; 0.49; and 0.55. The six vehicles are 18, 21, 20, 23, 17 and 19 ft respectively.
Calculate:
b. What is the % lane occupancy?
Expert Solution
arrow_forward
Step 1

Step by stepSolved in 2 steps with 2 images

Knowledge Booster
Similar questions
- Assume you are an observer standing at a point along a three‐lane roadway. All vehicles in lane 1 are traveling at 30 mi/hr, all vehicles in lane 2 are traveling at 45 mi/hr, and all vehicles in lane 3 are traveling at 60 mi/hr. The spacing between vehicles in each lane is 0.5 mile. If you collect spot speed data for all vehicles as they cross your observation point for 2 hours, what will be the time‐mean speed and space‐mean speed for this traffic stream?arrow_forward7. The following are the tabulation of the coverage count of the average daily traffic on a monthly and weekly basis made with automatic traffic counts on a highway. Use the tables to calculate;(a) the ADT for February and October based on 2 days counts: (i) on Tuesday in February the daily counts were 250 vehicles and (ii) on Friday in October, the daily traffic volume was 300 vehicles. (b) the AADT if the flows counted on Friday, Saturday and Sunday in July were 8000, 6000 and 5000 vehicles on a 16 hourly count basis.(c) the seven day 16 hourly flow in September.arrow_forwardQuestion 4 Vehicles begin to arrive at a border gate at 06h50 with a deterministic arrival rate of λ (t) = 5.2 - 0.01t (λ is in vehicles per minute and t in minutes after 06h50). However, the gate opens at 07h00 and serves vehicles at a rate of μµ(t) =3.3 + 2.4t (with t in minutes after 07h00 and u in vehicles per minute). Once the service rate reaches 10 vehicles per minute, it stays at that level for the rest of the day. ● ● Illustrate the operational characteristics of the vehicle queue-delay on a (cumulative) vehicle-Time graph. When will the queue that forms be dissipated? What will be the maximum queue length? Determine the total delay.arrow_forward
- q.complete. Answer.arrow_forward14.6 Car 15.2 Car 19.0 Truck 15.5 Car 14.3 Car 17.4 Truck 13.7 Car The vehicles were selected by sampling whatever vehicle was entering the section, choosing every 30 seconds. Estimate the time mean speed and the space mean speed, by vehicle type, and overallarrow_forwardThe following travel times were observed for 4 vehicles traveling a one km segment of the SLEX. It is required to determine the space mean speed of these vehiclesarrow_forward
arrow_back_ios
arrow_forward_ios
Recommended textbooks for you

 Structural Analysis (10th Edition)Civil EngineeringISBN:9780134610672Author:Russell C. HibbelerPublisher:PEARSON
 Principles of Foundation Engineering (MindTap Cou...Civil EngineeringISBN:9781337705028Author:Braja M. Das, Nagaratnam SivakuganPublisher:Cengage Learning
 Fundamentals of Structural AnalysisCivil EngineeringISBN:9780073398006Author:Kenneth M. Leet Emeritus, Chia-Ming Uang, Joel LanningPublisher:McGraw-Hill Education
 Traffic and Highway EngineeringCivil EngineeringISBN:9781305156241Author:Garber, Nicholas J.Publisher:Cengage Learning


Structural Analysis (10th Edition)
Civil Engineering
ISBN:9780134610672
Author:Russell C. Hibbeler
Publisher:PEARSON

Principles of Foundation Engineering (MindTap Cou...
Civil Engineering
ISBN:9781337705028
Author:Braja M. Das, Nagaratnam Sivakugan
Publisher:Cengage Learning

Fundamentals of Structural Analysis
Civil Engineering
ISBN:9780073398006
Author:Kenneth M. Leet Emeritus, Chia-Ming Uang, Joel Lanning
Publisher:McGraw-Hill Education


Traffic and Highway Engineering
Civil Engineering
ISBN:9781305156241
Author:Garber, Nicholas J.
Publisher:Cengage Learning