
MATLAB: An Introduction with Applications
6th Edition
ISBN: 9781119256830
Author: Amos Gilat
Publisher: John Wiley & Sons Inc
expand_more
expand_more
format_list_bulleted
Related questions
Concept explainers
Topic Video
Question
#9

Transcribed Image Text:**Educational Text on Hypothesis Testing**
**Critical Thinking:**
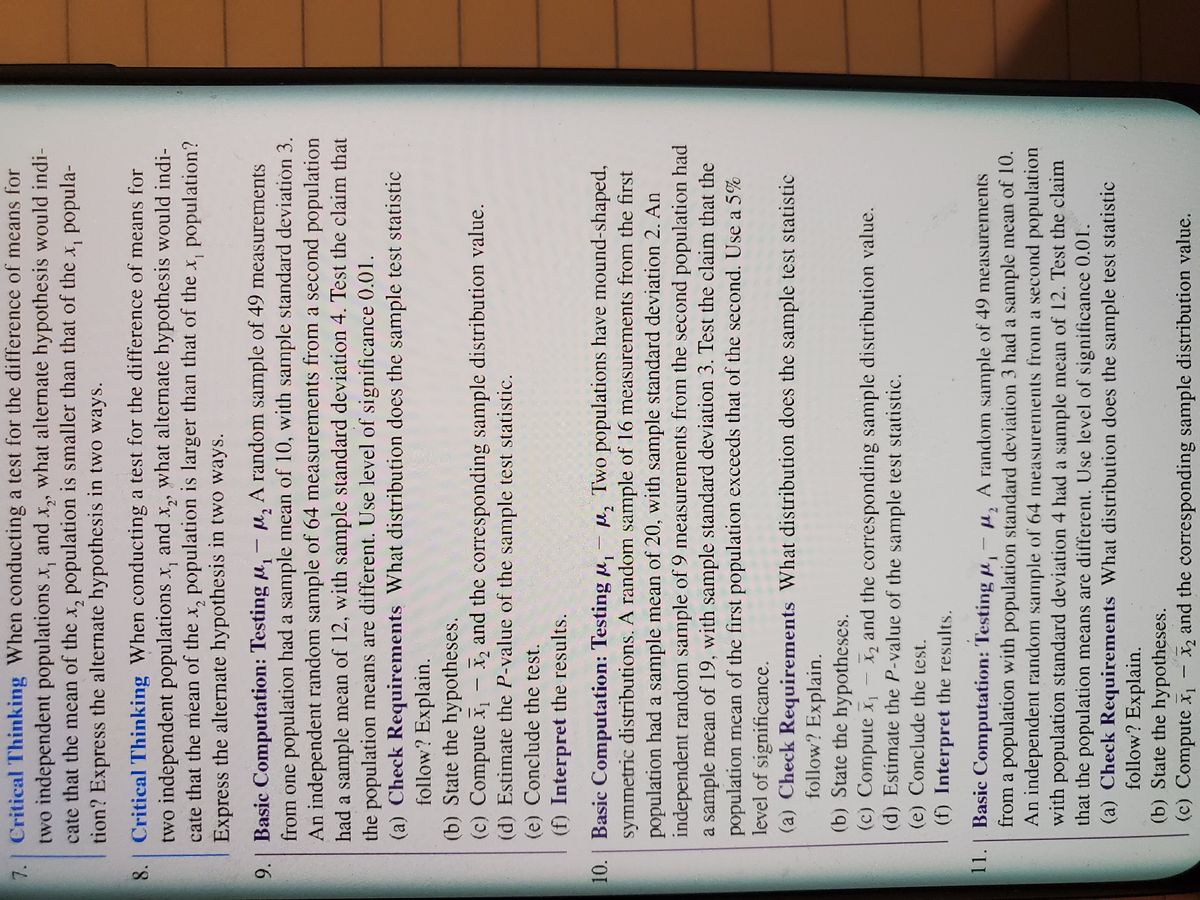
7. When conducting a test for the difference of means for two independent populations, what alternate hypothesis would indicate the mean of the first population is smaller than that of the second population? Express the alternate hypothesis in two ways.
8. When conducting a test for the difference of means for two independent populations, what alternate hypothesis would indicate the mean of the first population is larger than that of the second population?
**Basic Computation: Testing \( \mu_1 - \mu_2 \):**
9. A random sample of 49 measurements from one population had a sample mean of 10, with sample standard deviation 3. An independent random sample of 64 measurements from the second population had a sample mean of 12, with sample standard deviation 2. Test the claim that the population mean of the first population exceeds that of the second. Use a 1% level of significance.
**Check Requirements:**
- (a) What distribution does the sample test statistic follow? Explain.
- (b) State the hypotheses.
- (c) Compute the P-value of the sample test statistic.
- (d) Conclude the test.
- (e) Interpret the results.
10. Same information as question 9, but use a 5% level of significance instead of 1%.
**Check Requirements:**
- (a) What distribution does the sample test statistic follow? Explain.
- (b) State the hypotheses.
- (c) Compute the P-value of the sample test statistic.
- (d) Conclude the test.
- (e) Interpret the results.
**Basic Computation: Testing \( \mu_1 - \mu_2 \):**
11. A random sample of 49 measurements from one population had a sample mean of 10, with sample standard deviation 3. An independent random sample of 64 measurements from the second population had a sample mean of 12, with a sample standard deviation of 2. Test the claim that the population mean of the first population is different from that of the second. Use a 5% level of significance.
**Check Requirements:**
- (a) What distribution does the sample test statistic follow? Explain.
- (b) State the hypotheses.
- (c) Compute the P-value of the sample test statistic.
- (d) Con
Expert Solution
This question has been solved!
Explore an expertly crafted, step-by-step solution for a thorough understanding of key concepts.

This is a popular solution

Trending nowThis is a popular solution!

Step by stepSolved in 3 steps

Knowledge Booster


Learn more about
Need a deep-dive on the concept behind this application? Look no further. Learn more about this topic, statistics and related others by exploring similar questions and additional content below.Similar questions
Recommended textbooks for you
- MATLAB: An Introduction with ApplicationsStatisticsISBN:9781119256830Author:Amos GilatPublisher:John Wiley & Sons Inc
 Probability and Statistics for Engineering and th...StatisticsISBN:9781305251809Author:Jay L. DevorePublisher:Cengage Learning
 Statistics for The Behavioral Sciences (MindTap C...StatisticsISBN:9781305504912Author:Frederick J Gravetter, Larry B. WallnauPublisher:Cengage Learning
  Elementary Statistics: Picturing the World (7th E...StatisticsISBN:9780134683416Author:Ron Larson, Betsy FarberPublisher:PEARSON
 The Basic Practice of StatisticsStatisticsISBN:9781319042578Author:David S. Moore, William I. Notz, Michael A. FlignerPublisher:W. H. Freeman
 Introduction to the Practice of StatisticsStatisticsISBN:9781319013387Author:David S. Moore, George P. McCabe, Bruce A. CraigPublisher:W. H. Freeman
MATLAB: An Introduction with Applications
Statistics
ISBN:9781119256830
Author:Amos Gilat
Publisher:John Wiley & Sons Inc
Probability and Statistics for Engineering and th...
Statistics
ISBN:9781305251809
Author:Jay L. Devore
Publisher:Cengage Learning
Statistics for The Behavioral Sciences (MindTap C...
Statistics
ISBN:9781305504912
Author:Frederick J Gravetter, Larry B. Wallnau
Publisher:Cengage Learning
Elementary Statistics: Picturing the World (7th E...
Statistics
ISBN:9780134683416
Author:Ron Larson, Betsy Farber
Publisher:PEARSON
The Basic Practice of Statistics
Statistics
ISBN:9781319042578
Author:David S. Moore, William I. Notz, Michael A. Fligner
Publisher:W. H. Freeman
Introduction to the Practice of Statistics
Statistics
ISBN:9781319013387
Author:David S. Moore, George P. McCabe, Bruce A. Craig
Publisher:W. H. Freeman