MATLAB: An Introduction with Applications
6th Edition
ISBN: 9781119256830
Author: Amos Gilat
Publisher: John Wiley & Sons Inc
expand_more
expand_more
format_list_bulleted
Question
9.57

Transcribed Image Text:331-9403-abf9e2add3f5/pages/a2ca3bd4df635a91c6313a16cb6380e7e1b8484ed?location=%7B"id"%3...
ear
tion
ed...
9.570
958
Chapter 9: Section Exercises
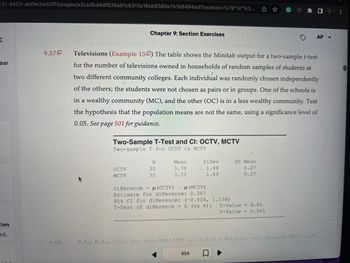
Televisions (Example 150) The table shows the Minitab output for a two-sample t-test
for the number of televisions owned in households of random samples of students at
two different community colleges. Each individual was randomly chosen independently
of the others; the students were not chosen as pairs or in groups. One of the schools is
in a wealthy community (MC), and the other (OC) is in a less wealthy community. Test
the hypothesis that the population means are not the same, using a significance level of
0.05. See page 501 for guidance.
Two-Sample T-Test and CI: OCTV, MCTV
Two-sample T for OCTV cs MCTV
OCTV
MOTV
N
30
30
Mean
3.70
3.33
StDev
1.49
1.49
Difference = μ (OCTV) - μ (MCTV)
Estimate for difference: 0.367
95% CI for difference: (-0.404, 1.138)
T-Test of difference = 0 (vs ) :
494
SE Mean
0.27
0.27
T-Value = 0.95
P-Value = 0.345
Pulse Rates sing data from NHANES, we looked at the pulse rates of nearly 800 people
▶
AP
Expert Solution
This question has been solved!
Explore an expertly crafted, step-by-step solution for a thorough understanding of key concepts.
Step by stepSolved in 2 steps

Knowledge Booster
Similar questions
arrow_back_ios
arrow_forward_ios
Recommended textbooks for you
 MATLAB: An Introduction with ApplicationsStatisticsISBN:9781119256830Author:Amos GilatPublisher:John Wiley & Sons Inc
 Probability and Statistics for Engineering and th...StatisticsISBN:9781305251809Author:Jay L. DevorePublisher:Cengage Learning
 Statistics for The Behavioral Sciences (MindTap C...StatisticsISBN:9781305504912Author:Frederick J Gravetter, Larry B. WallnauPublisher:Cengage Learning
 Elementary Statistics: Picturing the World (7th E...StatisticsISBN:9780134683416Author:Ron Larson, Betsy FarberPublisher:PEARSON
 The Basic Practice of StatisticsStatisticsISBN:9781319042578Author:David S. Moore, William I. Notz, Michael A. FlignerPublisher:W. H. Freeman
 Introduction to the Practice of StatisticsStatisticsISBN:9781319013387Author:David S. Moore, George P. McCabe, Bruce A. CraigPublisher:W. H. Freeman

MATLAB: An Introduction with Applications
Statistics
ISBN:9781119256830
Author:Amos Gilat
Publisher:John Wiley & Sons Inc

Probability and Statistics for Engineering and th...
Statistics
ISBN:9781305251809
Author:Jay L. Devore
Publisher:Cengage Learning

Statistics for The Behavioral Sciences (MindTap C...
Statistics
ISBN:9781305504912
Author:Frederick J Gravetter, Larry B. Wallnau
Publisher:Cengage Learning

Elementary Statistics: Picturing the World (7th E...
Statistics
ISBN:9780134683416
Author:Ron Larson, Betsy Farber
Publisher:PEARSON

The Basic Practice of Statistics
Statistics
ISBN:9781319042578
Author:David S. Moore, William I. Notz, Michael A. Fligner
Publisher:W. H. Freeman

Introduction to the Practice of Statistics
Statistics
ISBN:9781319013387
Author:David S. Moore, George P. McCabe, Bruce A. Craig
Publisher:W. H. Freeman