
MATLAB: An Introduction with Applications
6th Edition
ISBN: 9781119256830
Author: Amos Gilat
Publisher: John Wiley & Sons Inc
expand_more
expand_more
format_list_bulleted
Related questions
Question

Transcribed Image Text:9.
value=
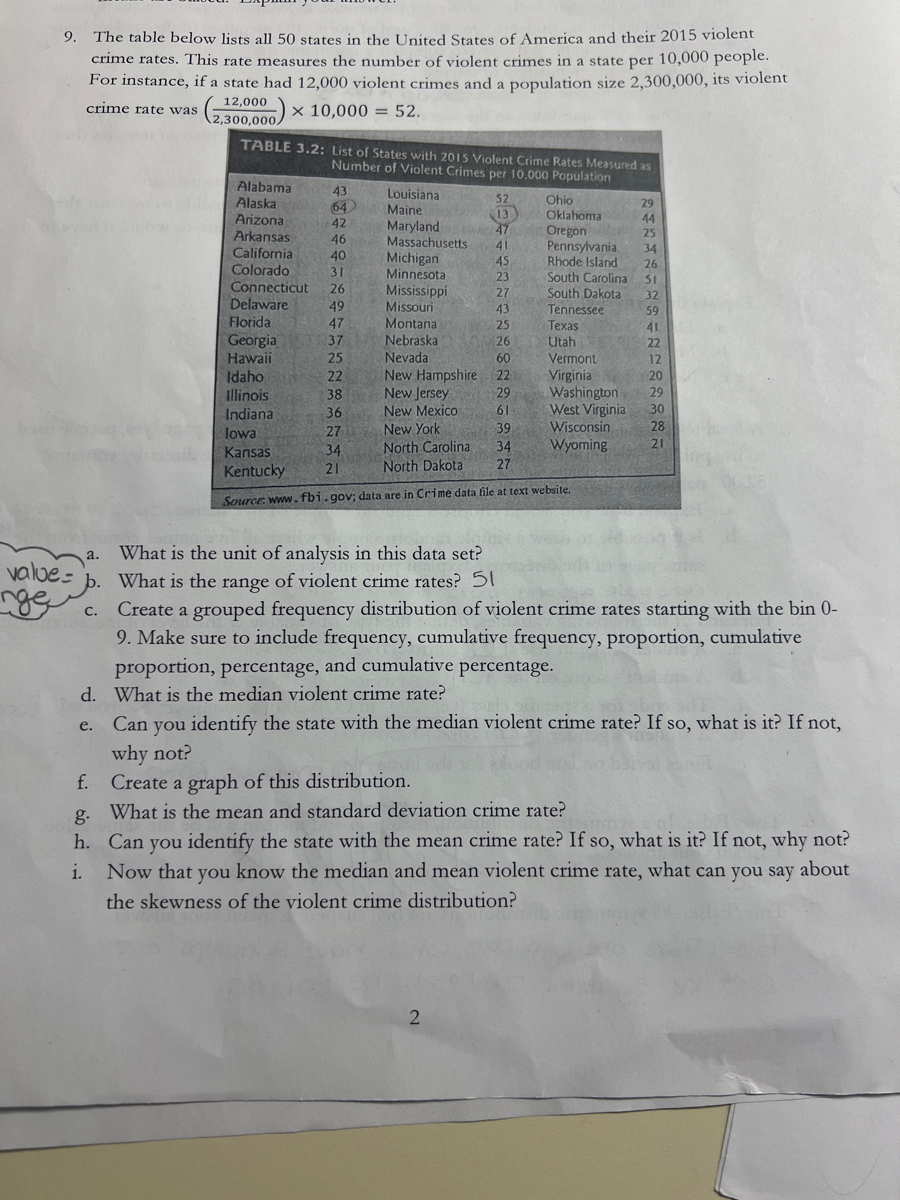
The table below lists all 50 states in the United States of America and their 2015 violent
crime rates. This rate measures the number of violent crimes in a state per 10,000 people.
For instance, if a state had 12,000 violent crimes and a population size 2,300,000, its violent
crime rate was
$(2,300,00) 10,000 = 52.
a.
C.
d.
e.
X
TABLE 3.2: List of States with 2015 Violent Crime Rates Measured as
Number of Violent Crimes per 10.000 Population
Alabama
Alaska
Arizona
Arkansas
California
Colorado
Connecticut
Delaware
Florida
Georgia
Hawaii
Idaho
Illinois
Indiana
lowa
Kansas
Kentucky
43
64
42
46
40
31
26
49
47
37
25
22
38
36
27
34
21
Louisiana
52
Maine
13
Maryland 47
Massachusetts 41
Michigan
45
20
Minnesota
23
24
Mississippi
27
7
Missouri
43
20
Montana
25
Nebraska
26
Nevada
60
New Hampshire 22
New Jersey
29
New Mexico
61
New York
North Carolina
North Dakota
Ohio
Oklahoma
Oregon
Pennsylvania
Rhode Island
South Carolina
South Dakota
Tennessee
Texas
Utah
Vermont
Virginia
Washington
West Virginia
Wisconsin
Wyoming
39
34
27
Source: www.fbi.gov; data are in Crime data file at text website.
2
29
44
25
34
26
51
32
59
41
22
f. Create a graph of this distribution.
g. What is the mean and standard deviation crime rate?
12
20
29
30
What is the unit of analysis in this data set?
What is the range of violent crime rates? 51
Create a grouped frequency distribution of violent crime rates starting with the bin 0-
9. Make sure to include frequency, cumulative frequency, proportion, cumulative
proportion, percentage, and cumulative percentage.
What is the median violent crime rate?
28
21
Can you identify the state with the median violent crime rate? If so, what is it? If not,
why not?
i.
h. Can you identify the state with the mean crime rate? If so, what is it? If not, why not?
Now that you know the median and mean violent crime rate, what can you say about
the skewness of the violent crime distribution?
![#
3
3
E
D
$
4
C
R
F
%
5
T
G
^
6
MacBook Pro
Y
H
&
7
j.
U
J
* 00
8
1
(
9
K
O
)
0
L
Statistics for Criminology and Criminal Justice
CCJS 200
P
TI
{
[
+ 11
=
}
]
delete
return
S. Tahamont
Fall 2023
Would you describe the violent crime rate as more leptokurtic or more platykurtic?
Explain your answer.
k. Will the mean of the 50 state violent crime rates equal the U.S. violent crime rate?
Explain your answer.
Explain your answer.
about the proportion of individuals held in community
dividuals held in community correctional facilities in](https://content.bartleby.com/qna-images/question/5f8e17d3-2f7a-41a7-a535-7cde1dfc07d3/d094351d-36c8-40df-8e29-333778c6cfde/a8llyo_processed.jpeg)
Transcribed Image Text:#
3
3
E
D
$
4
C
R
F
%
5
T
G
^
6
MacBook Pro
Y
H
&
7
j.
U
J
* 00
8
1
(
9
K
O
)
0
L
Statistics for Criminology and Criminal Justice
CCJS 200
P
TI
{
[
+ 11
=
}
]
delete
return
S. Tahamont
Fall 2023
Would you describe the violent crime rate as more leptokurtic or more platykurtic?
Explain your answer.
k. Will the mean of the 50 state violent crime rates equal the U.S. violent crime rate?
Explain your answer.
Explain your answer.
about the proportion of individuals held in community
dividuals held in community correctional facilities in
Expert Solution
This question has been solved!
Explore an expertly crafted, step-by-step solution for a thorough understanding of key concepts.

This is a popular solution

Trending nowThis is a popular solution!

Step by stepSolved in 5 steps with 9 images

Knowledge Booster

Similar questions
- Indiana's DOT announces a goal to reduce their motor vehicle death rate so that it is proportional to Illinois. How many deaths would Indiana be able to have to achieve this goal... Indiana deaths...693...populatin...6 million Illinois deaths...911...population...12.4 millionarrow_forwardC8. According to the Pew Research Center (2015), recent immigrants are better educated than earlier immigrants to the United States. The change was attributed to the availability of better education in each region or country of origin. The percentage of immigrants 25 years of age and older who completed at least high school is reported in this table for 1970 to 2013. Write a statement describing the change over time in the percentage who completed at least a high school degree. 1970 1980 1990 2000 2013 Mexico 14 17 26 30 48 Other Central/South America 57 53 60 66 Asia 75 72 75 82 84 48 68 81 87 95 Europe 36 48 52 58 72 Caribbean 81 91 88 85 85 Africa Source: Pew Research Center, Modern Immigration Wave Brings 59 Million to U.S., Driving Population Growth and Change Through 2065, 2015. Retrieved from https://www.pewresearch.org/hispanic/2015/09/28/modern- immigration-wave-brings-59-million-to-u-s-driving-population-growth-and-change-through-2065/ 52arrow_forwardOpinions are split about a coffee company's pumpkin-flavored coffee (PFC). Yet every year over the last five years the consumption of pumpkin-flavored goods has increased. If we look at the numbers, it also becomes clear why a leading coffee company keeps offering the PFC earlier and earlier every year. According to a magazine, the amount spent by PFC buyers at the coffee company is about 17% higher than non-PFC buyers. The accompanying table shows a random sample of eight consumers, the amount they spend per week, and the number of PFCs purchased per week. PFC Spending 2 13.88 7 39.11 4 19.79 1 9.84 3 15.43 1 21.52 5 37.39 3 13.85 Calculate the slope and y-intercept for the regression formula. The slope is b1=(Round to three decimal places as needed.)arrow_forward
- Opinions are split about a coffee company's pumpkin-flavored coffee (PFC). Yet every year over the last five years the consumption of pumpkin-flavored goods has increased. If we look at the numbers, it also becomes clear why a leading coffee company keeps offering the PFC earlier and earlier every year. According to a magazine, the amount spent by PFC buyers at the coffee company is about 17% higher than non-PFC buyers. The accompanying table shows a random sample of eight consumers, the amount they spend per week, and the number of PFCs purchased per week. PFC Spending 2 13.88 7 39.11 4 19.79 1 9.84 3 15.43 1 21.52 5 37.39 3 13.85 The slope is b1=4.465 The y-intercept is b0=6.840 Because the slope is positive, it can be concluded that one extra PFC purchase per week will increase the average amount of spending per week by 4.46 dollars. Predict…arrow_forwardAn interdepartmental task force is being formed to investigate an increase in violent crimes. 1/5 of the task force will be police officers from the local precinct. 1/4 will be ATF agents, and the remaining 22 will be from the FBI. How many people are participating in the task force?arrow_forwardA biologist gathered the following information about deer populations in a national park area. Juvenile (age ≤ 2 years) Adult (age > 2 years) Total Male 23 171 194 Female 112 935 1044 Total 135 1103 1238 The biologist made the calculation shown below. Which question was she trying to answer? 23 ÷ 194 a. What percentage of the male deer are juveniles? b. What percentage of the juvenile deer are males? c. What percentage of the total deer are juvenile males? d. What percentage of the total deer are males?arrow_forward
arrow_back_ios
arrow_forward_ios
Recommended textbooks for you
- MATLAB: An Introduction with ApplicationsStatisticsISBN:9781119256830Author:Amos GilatPublisher:John Wiley & Sons Inc
 Probability and Statistics for Engineering and th...StatisticsISBN:9781305251809Author:Jay L. DevorePublisher:Cengage Learning
 Statistics for The Behavioral Sciences (MindTap C...StatisticsISBN:9781305504912Author:Frederick J Gravetter, Larry B. WallnauPublisher:Cengage Learning
  Elementary Statistics: Picturing the World (7th E...StatisticsISBN:9780134683416Author:Ron Larson, Betsy FarberPublisher:PEARSON
 The Basic Practice of StatisticsStatisticsISBN:9781319042578Author:David S. Moore, William I. Notz, Michael A. FlignerPublisher:W. H. Freeman
 Introduction to the Practice of StatisticsStatisticsISBN:9781319013387Author:David S. Moore, George P. McCabe, Bruce A. CraigPublisher:W. H. Freeman
MATLAB: An Introduction with Applications
Statistics
ISBN:9781119256830
Author:Amos Gilat
Publisher:John Wiley & Sons Inc
Probability and Statistics for Engineering and th...
Statistics
ISBN:9781305251809
Author:Jay L. Devore
Publisher:Cengage Learning
Statistics for The Behavioral Sciences (MindTap C...
Statistics
ISBN:9781305504912
Author:Frederick J Gravetter, Larry B. Wallnau
Publisher:Cengage Learning
Elementary Statistics: Picturing the World (7th E...
Statistics
ISBN:9780134683416
Author:Ron Larson, Betsy Farber
Publisher:PEARSON
The Basic Practice of Statistics
Statistics
ISBN:9781319042578
Author:David S. Moore, William I. Notz, Michael A. Fligner
Publisher:W. H. Freeman
Introduction to the Practice of Statistics
Statistics
ISBN:9781319013387
Author:David S. Moore, George P. McCabe, Bruce A. Craig
Publisher:W. H. Freeman