
ENGR.ECONOMIC ANALYSIS
14th Edition
ISBN: 9780190931919
Author: NEWNAN
Publisher: Oxford University Press
expand_more
expand_more
format_list_bulleted
Related questions
Question
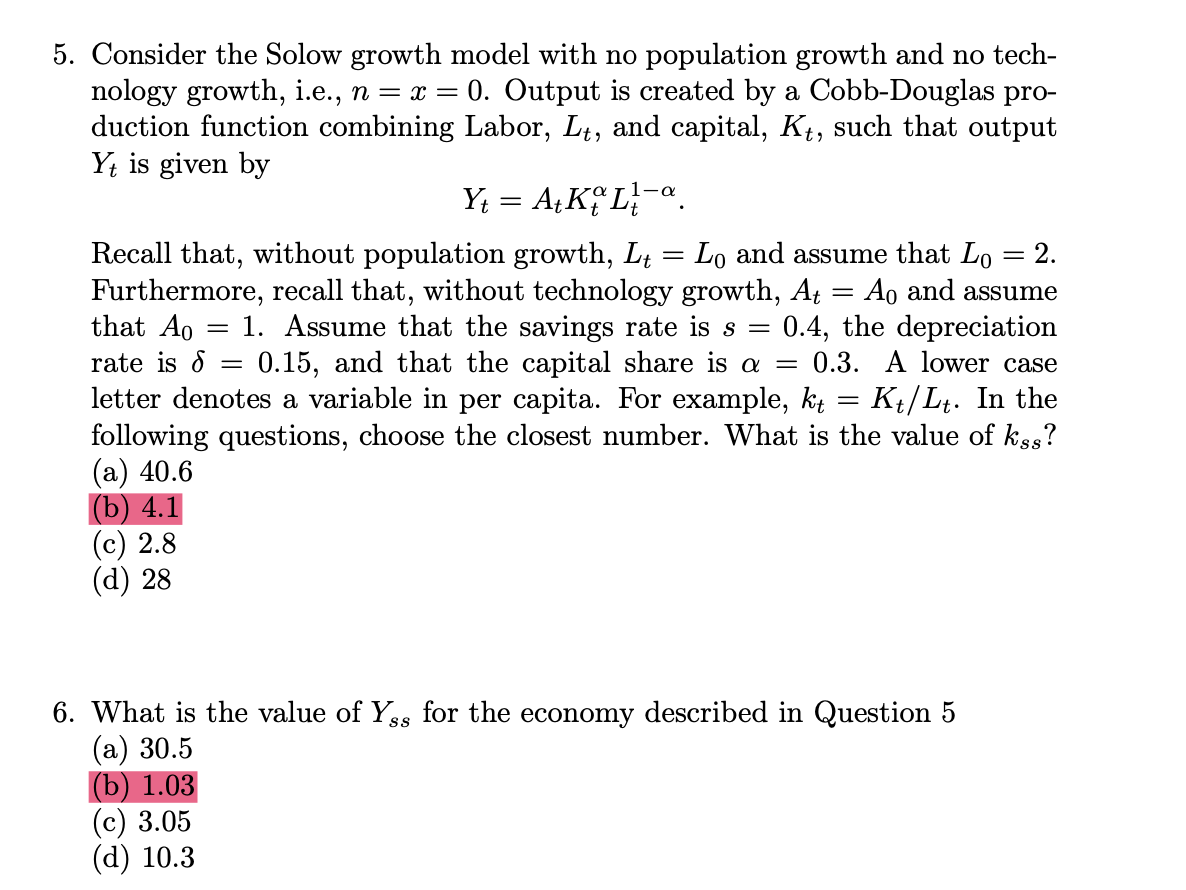

Transcribed Image Text:5. Consider the Solow growth model with no population growth and no tech-
nology growth, i.e., n = x = 0. Output is created by a Cobb-Douglas pro-
duction function combining Labor, Lt, and capital, Kt, such that output
Yt is given by
Y₁ = At Ko La
=
=
=
2.
Ao and assume
Recall that, without population growth, L₁ = Lo and assume that Lo
Furthermore, recall that, without technology growth, At
that Ao = 1. Assume that the savings rate is s
rate is 8: 0.15, and that the capital share is a =
letter denotes a variable in per capita. For example, kt
=
0.4, the depreciation
0.3. A lower case
=
Kt/Lt. In the
following questions, choose the closest number. What is the value of kss?
(a) 40.6
(b) 4.1
(c) 2.8
(d) 28
6. What is the value of Ys for the economy described in Question 5
(a) 30.5
(b) 1.03
(c) 3.05
(d) 10.3

Transcribed Image Text:9. Now consider growth, Suppose that x =
0.05 and that n =
0.03, i.e.,
A₁ = (1+0.05) At−1, and L₁ = (1 + 0.03) Lt−1·
The other parameters are same as in Question 5. what is capital per
efficiency units in steady state?
(a) 1.91
(b) 2.03
(c) 1.3
(d) 1.05
10. The capital share in Mexico is a = 1/3. Relative to last year, output
increased by 20%, capital increased by 10%, and total factor productivitity
increased by 5%. Which is the closest approximation for the growth in
the labor force, L?
(a) -3%
(b) 10%
c) 17.5%
(d) 0%
SAVE
AI-Generated Solution
info
AI-generated content may present inaccurate or offensive content that does not represent bartleby’s views.
Unlock instant AI solutions
Tap the button
to generate a solution
to generate a solution
Click the button to generate
a solution
a solution
Knowledge Booster

Similar questions
- Question Please provide justified answer asap to get a upvotearrow_forwardWhat is the mechanism in the Solow model that generates growth? Why isthis an appealing mechanism? Why does it fail to deliver economic growth inthe long run?arrow_forward5. When was the Solow growth model developed and what was significant about that period? What did it predict that was significant at the time? When was the endogenous growth model developed? What did researchers observe the world that led to its development? What is the main feature that differentiates the two?arrow_forward
- The basic Solow growth model was initially used to help governments of very low income nations measure what source of real GDP growth? O a) Growth due to factor accumulation. b) Growth due to technological progress. Oc) Growth due to efficiency gains. d) All of the abovearrow_forwardConsider the Solow growth model with no population growth and no tech- nology growth, i.e., n = x = 0. Output is created by a Cobb-Douglas pro- duction function combining Labor, Lt, and capital, Kt, such that output Yt is given by Y₁ = A+ KL-a = = 2. Recall that, without population growth, Lt = Lo and assume that Lo Furthermore, recall that, without technology growth, At Ao and assume that A0 = 1. Assume that the savings rate is s = 0.4, the depreciation rate is = 0.15, and that the capital share is a = 0.3. A lower case letter denotes a variable in per capita. For example, kt = K₁/Lt. In the following questions, choose the closest number. What is the value of kss? (a) 40.6 (b) 4.1 c) 2.8 (d) 28arrow_forwardConsider the Solow growth model with no population growth and no tech- nology growth, i.e., n = x = 0. Output is created by a Cobb-Douglas pro- duction function combining Labor, Lt, and capital, Kt, such that output Yt is given by Y₁ = A+ KL₁-a = = Ao and Recall that, without population growth, Lt Lo and assume that Lo = 10. Furthermore, recall that, without technology growth, At assume that A0 = 2. Assume that the savings rate is s = 0.2, the depre- ciation rate is 8 = 0.1, and that the capital share is a = 0.3. A lower case letter denotes a variable in per capita. For example, kt= Kt/Lt. In the following questions, choose the closest number. What is the value of kss? (a) 72 (b) 27 (c) 7.2 (d) 2.7 What is the value of Yss for the Economy described in Question 7 (a) 36 (b) 3.6 (c) 2.7 (d) 27 Suppose that the economy described in Question 7 economy starts with Ко = 10. Choose the correct one for the change in capital over time. (a) fall (b) grow (c) Once dropped, it grows (d) unchange…arrow_forward
arrow_back_ios
arrow_forward_ios
Recommended textbooks for you
 Principles of Economics (12th Edition)EconomicsISBN:9780134078779Author:Karl E. Case, Ray C. Fair, Sharon E. OsterPublisher:PEARSON
 Engineering Economy (17th Edition)EconomicsISBN:9780134870069Author:William G. Sullivan, Elin M. Wicks, C. Patrick KoellingPublisher:PEARSON
 Principles of Economics (MindTap Course List)EconomicsISBN:9781305585126Author:N. Gregory MankiwPublisher:Cengage Learning
 Managerial Economics: A Problem Solving ApproachEconomicsISBN:9781337106665Author:Luke M. Froeb, Brian T. McCann, Michael R. Ward, Mike ShorPublisher:Cengage Learning
 Managerial Economics & Business Strategy (Mcgraw-...EconomicsISBN:9781259290619Author:Michael Baye, Jeff PrincePublisher:McGraw-Hill Education
Principles of Economics (12th Edition)
Economics
ISBN:9780134078779
Author:Karl E. Case, Ray C. Fair, Sharon E. Oster
Publisher:PEARSON
Engineering Economy (17th Edition)
Economics
ISBN:9780134870069
Author:William G. Sullivan, Elin M. Wicks, C. Patrick Koelling
Publisher:PEARSON
Principles of Economics (MindTap Course List)
Economics
ISBN:9781305585126
Author:N. Gregory Mankiw
Publisher:Cengage Learning
Managerial Economics: A Problem Solving Approach
Economics
ISBN:9781337106665
Author:Luke M. Froeb, Brian T. McCann, Michael R. Ward, Mike Shor
Publisher:Cengage Learning
Managerial Economics & Business Strategy (Mcgraw-...
Economics
ISBN:9781259290619
Author:Michael Baye, Jeff Prince
Publisher:McGraw-Hill Education