
MATLAB: An Introduction with Applications
6th Edition
ISBN: 9781119256830
Author: Amos Gilat
Publisher: John Wiley & Sons Inc
expand_more
expand_more
format_list_bulleted
Related questions
Question
thumb_up100%
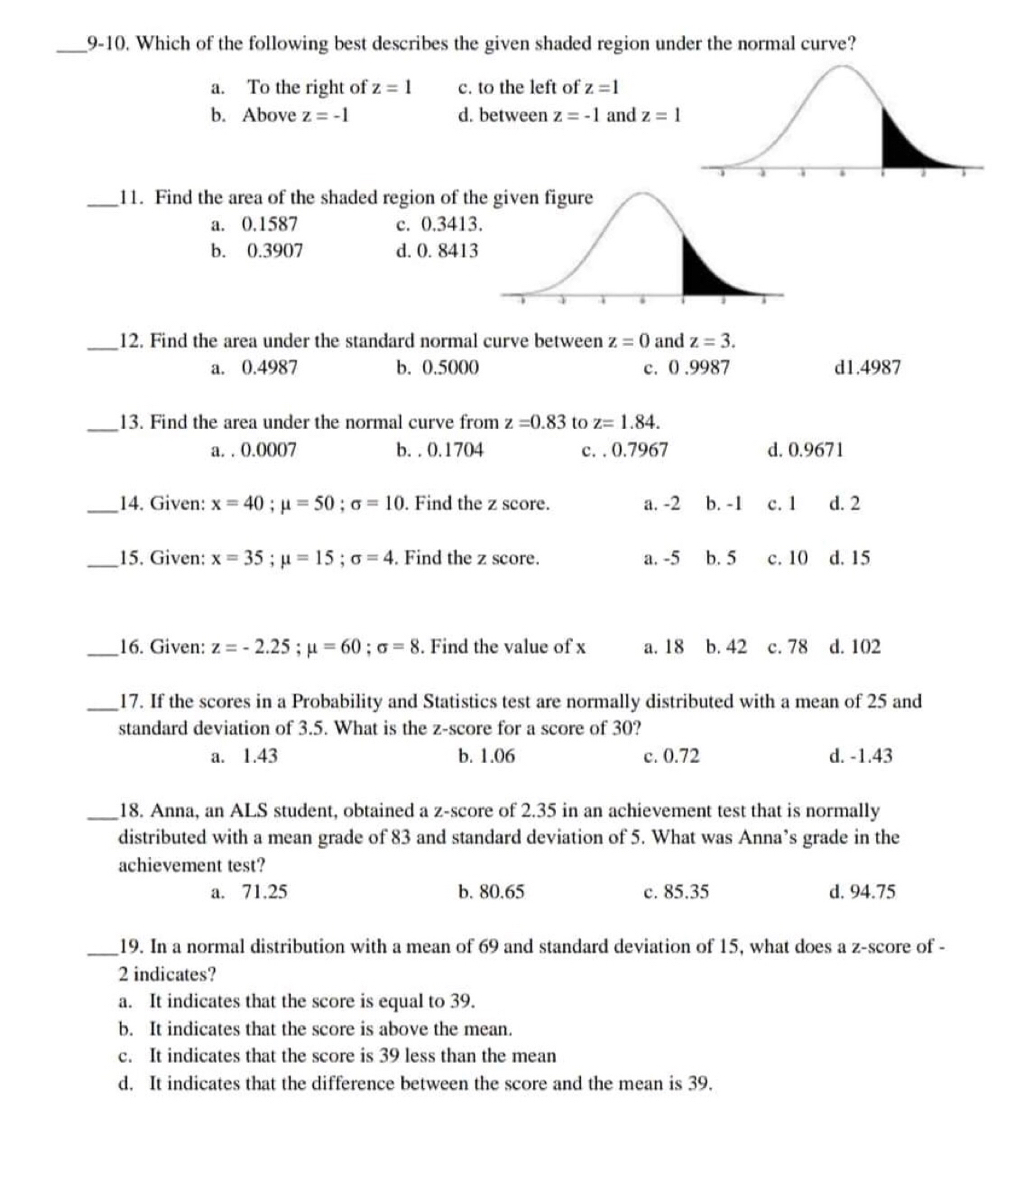

Transcribed Image Text:9-10. Which of the following best describes the given shaded region under the normal curve?
c. to the left of z=1
a. To the right of z = 1
b. Above z=-1
d. between z = -1 and z = 1
11. Find the area of the shaded region of the given figure
a.
0.1587
c. 0.3413.
b. 0.3907
d. 0. 8413
12. Find the area under the standard normal curve between z = 0 and z= 3.
a. 0.4987
b. 0.5000
c. 0.9987
d1.4987
13. Find the area under the normal curve from z=0.83 to z= 1.84.
a..0.0007
b..0.1704
c..0.7967
d. 0.9671
14. Given: x=40; μ = 50; o 10. Find the z score.
a. -2
b. -1
c. 1
d. 2
15. Given: x= 35; p = 15; o 4. Find the z score.
a. -5
b. 5
c. 10 d. 15
16. Given: z-2.25; μ=60; a= 8. Find the value of x
a. 18 b. 42 c. 78 d. 102
17. If the scores in a Probability and Statistics test are normally distributed with a mean of 25 and
standard deviation of 3.5. What is the z-score for a score of 30?
a. 1.43
b. 1.06
c. 0.72
d. -1.43
18. Anna, an ALS student, obtained a z-score of 2.35 in an achievement test that is normally
distributed with a mean grade of 83 and standard deviation of 5. What was Anna's grade in the
achievement test?
a. 71.25
b. 80.65
c. 85.35
d. 94.75
19. In a normal distribution with a mean of 69 and standard deviation of 15, what does a z-score of -
2 indicates?
a. It indicates that the score is equal to 39.
b. It indicates that the score is above the mean.
c. It indicates that the score is 39 less than the mean
d. It indicates that the difference between the score and the mean is 39.
Expert Solution
This question has been solved!
Explore an expertly crafted, step-by-step solution for a thorough understanding of key concepts.

Step by stepSolved in 4 steps

Knowledge Booster

Similar questions
- Suppose the lengths of human pregnancies are normally distributed with u = 266 days and o = 16 days. Complete parts (a) and (b) below. (a) The figure to the right represents the normal curve with µ = 266 days and o = 16 days. The area to the right of X= 300 is 0.0168. Provide two interpretations of this area. Provide one interpretation of the area using the given values. Select the correct choice below and fill in the answer boxes to complete your choice. (Type integers or decimals.) O A. The proportion of human pregnancies that last less than days is B. The proportion of human pregnancies that last more than days is 266 300 Provide a second interpretation of the area using the given values. Select the correct choice below and fill in the answer boxes to complete your choice. (Type integers or decimals.) A. The probability that a randomly selected human pregnancy lasts more than days is B. The probability that a randomly selected human pregnancy lasts less than days is (b) The figure…arrow_forwardPlease find the area under the normal curve for each 1 of these.arrow_forwardSuppose the lengths of human pregnancies are normally distributed with u = 266 days and o = 16 days. Complete parts (a) and (b) below. (a) The figure to the right represents the normal curve with µ = 266 days and o = 16 days. The area to the left of X = 235 is 0.0263. Provide two interpretations of this area. Provide one interpretation of the area using the given values. Select the correct choice below and fill in the answer boxes to complete your choice. (Type integers or decimals.) O A. The proportion of human pregnancies that last more than days is O B. The proportion of human pregnancies that last less than days is 235 Provide a second interpretation of the area using the given values. Select the correct choice below and fill in the answer boxes to complete your choice. (Type integers or decimals.) O A. The probability that a randomly selected human pregnancy lasts less than days is O B. The probability that a randomly selected human pregnancy lasts more than days is (b) The figure…arrow_forward
- Find the normal curve and show solutionsarrow_forwardSuppose the lengths of human pregnancies are normally distributed with p = 266 days and o = 16 days. Complete parts (a) and (b) below. (a) The figure to the right represents the normal curve with u = 266 days and o = 16 days. The area to the left of X = 230 is 0.0122. Provide two interpretations of this area. Provide one interpretation of the area using the given values. Select the correct choice below and fill in the answer boxes to complete your choice. (Type integers or decimals.) O A. The proportion of human pregnancies that last more than days is B. The proportion of human pregnancies that last less than days is 230 266 Provide a second interpretation of the area using the given values. Select the correct choice below and fill in the answer boxes to complete your choice. (Type integers or decimals.) A. The probability that a randomly selected human pregnancy lasts less than days is B. The probability that a randomly selected human pregnancy lasts more than days is (b) The figure…arrow_forwardFind the area under the Normal curve between the two z-values. Shade the area of theregion.arrow_forward
- (a) The figure to the right represents the normal curve with μ=266 days and σ=16 days. The area to the left of X=245 is 0.0947. Provide two interpretations of this area. Provide one interpretation of the area using the given values. Select the correct choice below and fill in the answer boxes to complete your choice. (Type integers or decimals.) A. The proportion of human pregnancies that last more than nothing days is nothing. B. The proportion of human pregnancies that last less than nothing days is nothing.arrow_forwardSecond interpretationarrow_forwardi need help with my stats and probability assignmentarrow_forward
- 1. Find the area between a z-score of -0.41 and 1.7. 2. FInd the area between a z-score of -0.41 and 0.arrow_forwardSuppose the lengths of human pregnancies are normally distributed with p = 266 days and o = 16 days. Complete parts (a) and (b) below. (a) The figure to the right represents the normal curve with u = 266 days and o = 16 days. The area to the right of X= 285 is 0.1175. Provide two interpretations of this area. Provide one interpretation of the area using the given values. Select the correct choice below and fill in the answer boxes to complete your choice. (Type integers or decimals.) O A. The proportion of human pregnancies that last more than days is 266 285 O B. The proportion pregnancies that last less thar days is Provide a second interpretation of the area using the given values. Select the correct choice below and fill in the answer boxes to complete your choice. (Type integers or decimals.) O A. The probability that a randomly selected human pregnancy lasts less than days is B. The probability that a randomly selected human pregnancy lasts more than days isarrow_forwardSuppose the lengths of human pregnancies are normally distributed with µ= 266 days ando = 16 days. Complete parts (a) and (b) below. (a) The figure to the right represents the normal curve with u = 266 days and o = 16 days. The area to the left of X= 250 is 0.1587. Provide two interpretations of this area. Provide one interpretation of the area using the given values. Select the correct choice below and fill in the answer boxes to complete your choice. (Type integers or decimals.) O A. The proportion of human pregnancies that last less than days is O B. The proportion of human pregnancies that last more than days is 250 266 Provide a second interpretation of the area using the given values. Select the correct choice below and fill in the answer boxes to complete your choice. (Type integers or decimals.) O A. The probability that a randomly selected human pregnancy lasts more than days is O B. The probability that a randomly selected human pregnancy lasts less than days is (b) The…arrow_forward
arrow_back_ios
arrow_forward_ios
Recommended textbooks for you
- MATLAB: An Introduction with ApplicationsStatisticsISBN:9781119256830Author:Amos GilatPublisher:John Wiley & Sons Inc
 Probability and Statistics for Engineering and th...StatisticsISBN:9781305251809Author:Jay L. DevorePublisher:Cengage Learning
 Statistics for The Behavioral Sciences (MindTap C...StatisticsISBN:9781305504912Author:Frederick J Gravetter, Larry B. WallnauPublisher:Cengage Learning
  Elementary Statistics: Picturing the World (7th E...StatisticsISBN:9780134683416Author:Ron Larson, Betsy FarberPublisher:PEARSON
 The Basic Practice of StatisticsStatisticsISBN:9781319042578Author:David S. Moore, William I. Notz, Michael A. FlignerPublisher:W. H. Freeman
 Introduction to the Practice of StatisticsStatisticsISBN:9781319013387Author:David S. Moore, George P. McCabe, Bruce A. CraigPublisher:W. H. Freeman
MATLAB: An Introduction with Applications
Statistics
ISBN:9781119256830
Author:Amos Gilat
Publisher:John Wiley & Sons Inc
Probability and Statistics for Engineering and th...
Statistics
ISBN:9781305251809
Author:Jay L. Devore
Publisher:Cengage Learning
Statistics for The Behavioral Sciences (MindTap C...
Statistics
ISBN:9781305504912
Author:Frederick J Gravetter, Larry B. Wallnau
Publisher:Cengage Learning
Elementary Statistics: Picturing the World (7th E...
Statistics
ISBN:9780134683416
Author:Ron Larson, Betsy Farber
Publisher:PEARSON
The Basic Practice of Statistics
Statistics
ISBN:9781319042578
Author:David S. Moore, William I. Notz, Michael A. Fligner
Publisher:W. H. Freeman
Introduction to the Practice of Statistics
Statistics
ISBN:9781319013387
Author:David S. Moore, George P. McCabe, Bruce A. Craig
Publisher:W. H. Freeman