
Applications and Investigations in Earth Science (9th Edition)
9th Edition
ISBN: 9780134746241
Author: Edward J. Tarbuck, Frederick K. Lutgens, Dennis G. Tasa
Publisher: PEARSON
expand_more
expand_more
format_list_bulleted
Related questions
Question
thumb_up100%
Using the T-S diagram, it is possible to identify density (isopycnals) produced by a particular temperature and salinity pairing.
8.Based on the positions of the different water samples plotted on the T-S diagram, ocean water density at the Atlantic Ocean site ______ with increasing depth.
a.increased
b.remained constant
c.decreased"
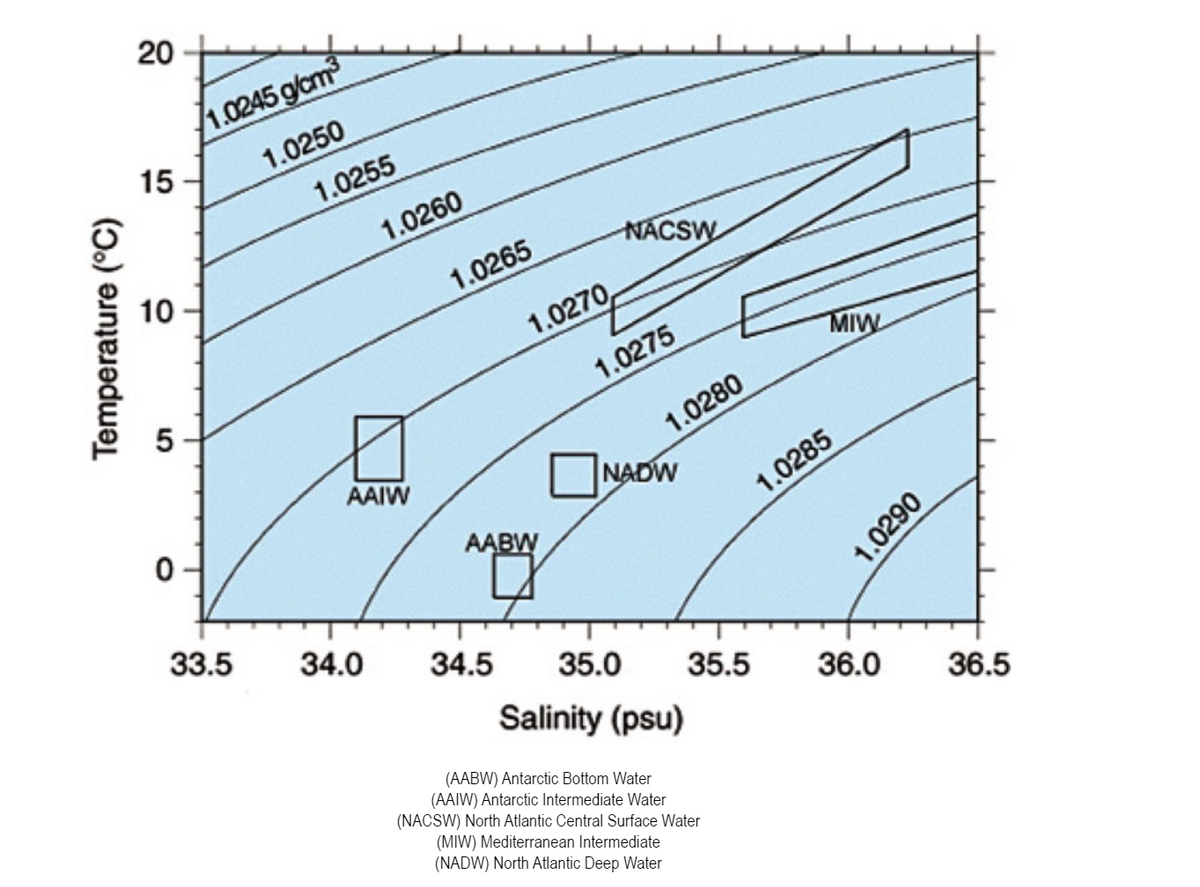

Transcribed Image Text:### Ocean Water Mass Properties: Temperatures and Salinities
This graph depicts the relationship between Temperature (°C) and Salinity (psu) of various ocean water masses at different depths. The graph features lines indicating specific density contours in g/cm³, labeled on the graph from 1.0245 to 1.0290. The y-axis represents Temperature (°C), ranging from 0 to 20°C, and the x-axis represents Salinity (psu), ranging from 33.5 to 36.5 psu.
#### Water Masses and Their Designations:
1. **AABW (Antarctic Bottom Water)**:
- Location: Around 0°C temperature and 34.6 psu salinity.
- Density: Approximately 1.0271 g/cm³.
2. **AAIW (Antarctic Intermediate Water)**:
- Location: Around 5°C temperature and 34.3 psu salinity.
- Density: Approximately 1.0265 g/cm³.
3. **NACSW (North Atlantic Central Surface Water)**:
- Location: Between 15-18°C temperatures and 35.8-36.2 psu salinities.
- Density: Ranges between 1.0250 to 1.0265 g/cm³.
4. **MIW (Mediterranean Intermediate Water)**:
- Location: Between 10-12°C temperatures and 36-36.2 psu salinities.
- Density: Ranges between 1.0275 to 1.0290 g/cm³.
5. **NADW (North Atlantic Deep Water)**:
- Location: Around 2-3°C temperatures and 34.8 psu salinities.
- Density: Approximately 1.0276 g/cm³.
Interpretations:
- The density lines provide an understanding of how different combinations of temperature and salinity correspond to specific densities of seawater.
- Water masses are marked with rectangles, indicating the range over which a particular water mass can be found in the context of temperature and salinity.
- The positioning and size of these rectangles offer insights into the variability and extent of these water masses.
Keep in mind that these properties and classifications are essential for understanding ocean circulation and its impact on global climate systems.
#### Abbreviations:
- **AABW**: Antarctic Bottom Water
-
Expert Solution
This question has been solved!
Explore an expertly crafted, step-by-step solution for a thorough understanding of key concepts.

This is a popular solution

Trending nowThis is a popular solution!

Step by stepSolved in 2 steps

Knowledge Booster

Recommended textbooks for you
- Applications and Investigations in Earth Science ...Earth ScienceISBN:9780134746241Author:Edward J. Tarbuck, Frederick K. Lutgens, Dennis G. TasaPublisher:PEARSON
 Exercises for Weather & Climate (9th Edition)Earth ScienceISBN:9780134041360Author:Greg CarbonePublisher:PEARSON
 Environmental ScienceEarth ScienceISBN:9781260153125Author:William P Cunningham Prof., Mary Ann Cunningham ProfessorPublisher:McGraw-Hill Education
  Earth Science (15th Edition)Earth ScienceISBN:9780134543536Author:Edward J. Tarbuck, Frederick K. Lutgens, Dennis G. TasaPublisher:PEARSON
 Environmental Science (MindTap Course List)Earth ScienceISBN:9781337569613Author:G. Tyler Miller, Scott SpoolmanPublisher:Cengage Learning
 Physical GeologyEarth ScienceISBN:9781259916823Author:Plummer, Charles C., CARLSON, Diane H., Hammersley, LisaPublisher:Mcgraw-hill Education,
Applications and Investigations in Earth Science ...
Earth Science
ISBN:9780134746241
Author:Edward J. Tarbuck, Frederick K. Lutgens, Dennis G. Tasa
Publisher:PEARSON
Exercises for Weather & Climate (9th Edition)
Earth Science
ISBN:9780134041360
Author:Greg Carbone
Publisher:PEARSON
Environmental Science
Earth Science
ISBN:9781260153125
Author:William P Cunningham Prof., Mary Ann Cunningham Professor
Publisher:McGraw-Hill Education
Earth Science (15th Edition)
Earth Science
ISBN:9780134543536
Author:Edward J. Tarbuck, Frederick K. Lutgens, Dennis G. Tasa
Publisher:PEARSON
Environmental Science (MindTap Course List)
Earth Science
ISBN:9781337569613
Author:G. Tyler Miller, Scott Spoolman
Publisher:Cengage Learning
Physical Geology
Earth Science
ISBN:9781259916823
Author:Plummer, Charles C., CARLSON, Diane H., Hammersley, Lisa
Publisher:Mcgraw-hill Education,