Glencoe Algebra 1, Student Edition, 9780079039897, 0079039898, 2018
18th Edition
ISBN: 9780079039897
Author: Carter
Publisher: McGraw Hill
expand_more
expand_more
format_list_bulleted
Question

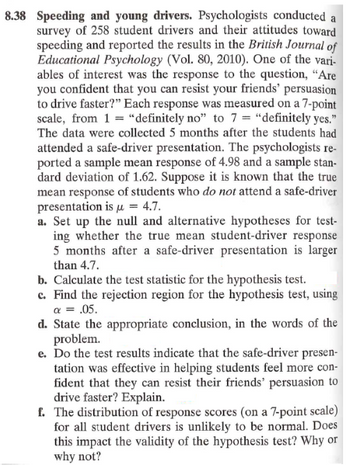
Transcribed Image Text:8.38 Speeding and young drivers. Psychologists conducted a
survey of 258 student drivers and their attitudes toward
speeding and reported the results in the British Journal of
Educational Psychology (Vol. 80, 2010). One of the vari-
ables of interest was the response to the question, "Are
you confident that you can resist your friends' persuasion
to drive faster?" Each response was measured on a 7-point
scale, from 1 = "definitely no" to 7 = "definitely yes."
The data were collected 5 months after the students had
attended a safe-driver presentation. The psychologists re-
ported a sample mean response of 4.98 and a sample stan-
dard deviation of 1.62. Suppose it is known that the true
mean response of students who do not attend a safe-driver
presentation is μ = 4.7.
a. Set up the null and alternative hypotheses for test-
ing whether the true mean student-driver response
5 months after a safe-driver presentation is larger
than 4.7.
b. Calculate the test statistic for the hypothesis test.
c. Find the rejection region for the hypothesis test, using
a = .05.
d. State the appropriate conclusion, in the words of the
problem.
e. Do the test results indicate that the safe-driver presen-
tation was effective in helping students feel more con-
fident that they can resist their friends' persuasion to
drive faster? Explain.
f. The distribution of response scores (on a 7-point scale)
for all student drivers is unlikely to be normal. Does
this impact the validity of the hypothesis test? Why or
why not?
Expert Solution
This question has been solved!
Explore an expertly crafted, step-by-step solution for a thorough understanding of key concepts.
Step by stepSolved in 2 steps

Knowledge Booster
Recommended textbooks for you
 Glencoe Algebra 1, Student Edition, 9780079039897...AlgebraISBN:9780079039897Author:CarterPublisher:McGraw Hill
 Big Ideas Math A Bridge To Success Algebra 1: Stu...AlgebraISBN:9781680331141Author:HOUGHTON MIFFLIN HARCOURTPublisher:Houghton Mifflin Harcourt
 Holt Mcdougal Larson Pre-algebra: Student Edition...AlgebraISBN:9780547587776Author:HOLT MCDOUGALPublisher:HOLT MCDOUGAL

Glencoe Algebra 1, Student Edition, 9780079039897...
Algebra
ISBN:9780079039897
Author:Carter
Publisher:McGraw Hill

Big Ideas Math A Bridge To Success Algebra 1: Stu...
Algebra
ISBN:9781680331141
Author:HOUGHTON MIFFLIN HARCOURT
Publisher:Houghton Mifflin Harcourt

Holt Mcdougal Larson Pre-algebra: Student Edition...
Algebra
ISBN:9780547587776
Author:HOLT MCDOUGAL
Publisher:HOLT MCDOUGAL