
MATLAB: An Introduction with Applications
6th Edition
ISBN: 9781119256830
Author: Amos Gilat
Publisher: John Wiley & Sons Inc
expand_more
expand_more
format_list_bulleted
Related questions
Concept explainers
Topic Video
Question
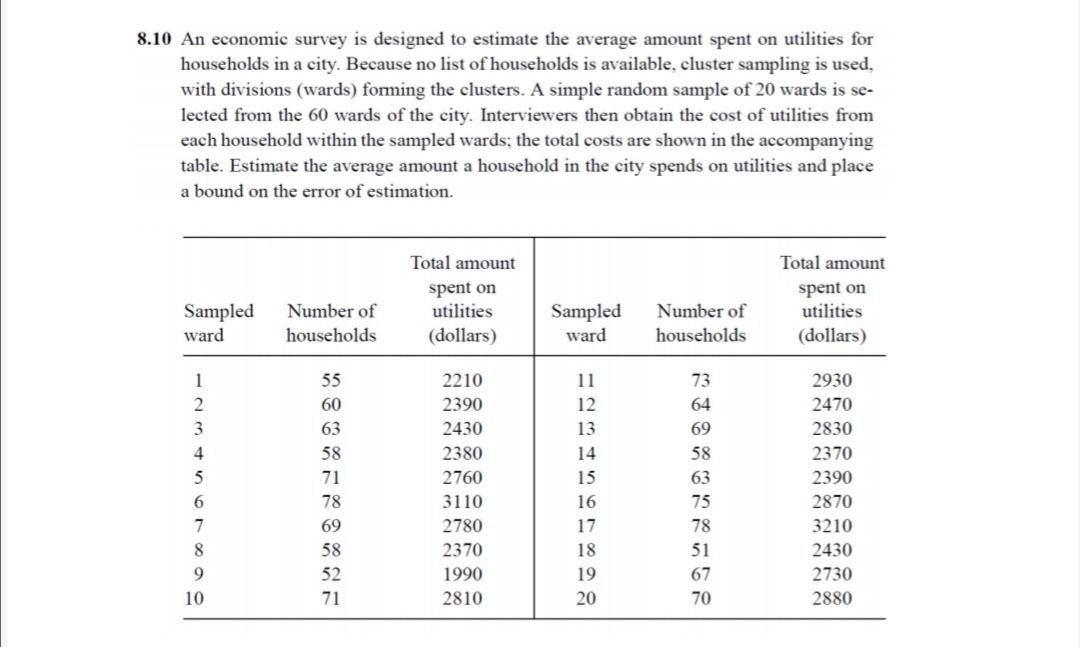

Transcribed Image Text:8.10 An economic survey is designed to estimate the average amount spent on utilities for
households in a city. Because no list of households is available, cluster sampling is used,
with divisions (wards) forming the clusters. A simple random sample of 20 wards is se-
lected from the 60 wards of the city. Interviewers then obtain the cost of utilities from
each household within the sampled wards; the total costs are shown in the accompanying
table. Estimate the average amount a household in the city spends on utilities and place
a bound on the error of estimation.
Total amount
Total amount
spent on
utilities
spent on
utilities
Sampled
Number of
Number of
Sampled
ward
ward
households
(dollars)
households
(dollars)
1
55
2210
11
73
2930
2
60
2390
12
64
2470
3
63
2430
13
69
2830
4
58
2380
14
58
2370
5
71
2760
15
63
2390
78
3110
16
75
2870
7
69
2780
17
78
3210
8.
58
2370
18
51
2430
9.
52
1990
19
67
2730
10
71
2810
20
70
2880
Expert Solution
This question has been solved!
Explore an expertly crafted, step-by-step solution for a thorough understanding of key concepts.

This is a popular solution

Trending nowThis is a popular solution!

Step by stepSolved in 3 steps with 3 images

Knowledge Booster


Learn more about
Need a deep-dive on the concept behind this application? Look no further. Learn more about this topic, statistics and related others by exploring similar questions and additional content below.Similar questions
- Use the boxplot below to answer the following questions about the number of stocks sold by three companies. Company C B A 0 Distribution of Number of of Stocks Sold 2000 4000 6000 Number of Stocks Sold 8000 Assuming that all of the values in the data set are unique, how many outliers are there in the data set indicated by the box plots?arrow_forwardAre cigarettes bad for people? Cigarette smoking involves tar, carbon monoxide, and nicotine (measured in milligrams). The first two are definitely not good for a person's health, and the last ingredient can cause addiction. Use the data in the table above to make a stem-and-leaf display for milligrams of tar per cigarette smoked. (Enter NONE in any unused answer blanks.) Are there any outliers? A. Yes, 1.0 may be an outlier. B. No, there are no outliers. C. Yes, 29.8 may be an outlier.arrow_forwardJoan's Nursery specializes in custom-designed landscaping for residential areas. The estimated labor cost associated with a particular landscaping proposal is based on the number of plantings of trees, shrubs, and so on to be used for the project. For cost-estimating purposes, managers use two hours of labor time for the planting of a medium-sized tree. Actual times from a sample of 10 plantings during the past month follow (times in hours). B, C, and Darrow_forward
- The International League of Triple-A minor league baseball consists of 14 teams organized into three divisions: North, South, and West. The data showing the average attendance for the 14 teams in the International League are contained in the Excel Online file below. Also shown are the teams’ records; W denotes the number of games won, L denotes the number of games lost, and PCT is the proportion of games played that were won. Construct a spreadsheet to answer the following questions. Team Name Division W L PCT Attendance Buffalo Bisons North 66 77 0.462 8791 Lehigh Valley IronPigs North 55 89 0.382 8454 Pawtucket Red Sox North 85 58 0.594 9080 Rochester Red Wings North 79 70 0.53 6909 Scranton-Wilkes Barre Yankees North 88 56 0.611 7164 Syracuse Chiefs North 69 77 0.473 5749 Charlotte Knights South 68 78 0.466 4545 Durham Bulls South 74 70 0.514 7020 Norfolk Tides South 64 78 0.451 6269 Richmond Braves South 63 79 0.444 4449 Columbus Clippers West 69 73 0.486…arrow_forwardAn agent for a residential real estate company in a large city has the business objective of developing more accurate estimates of the monthly rental cost for apartments. Toward that goal, the agent would like to use the size of an apartment, as defined by square footage to predict the monthly rental cost. The agent selects a sample of 25 apartments in a particular residential neighborhood and collects the following data: Size (square feet) Rent ($) 850 1950 1450 2600 1085 2200 1232 2500 718 1950 1485 2700 1136 2650 726 1935 700 1875 956 2150 1100 2400 1285 2650 1985 3300 1369 2800 1175 2400 1225 2450 1245 2100 1259 2700 1150 2200 896 2150 1361 2600 1040 2650 755 2200 1000 1800 1200 2750 (a) Determine the coefficient of determination, r2, and interpret its meaning. (b) Determine the standard error of the estimate (Syx).…arrow_forwardC6. How many hours per week do you spend on e-mail? Data are presented here for a GSS sample of 99 men and women, who each reported the number of hours they spent per week on e-mail. a. Compute the cumulative frequency and cumulative percentage distribution for the data. b. What proportion of the sample spent 3 hours or less per week on e-mail? C. What proportion of the sample spent 6 or more hours per week on e-mail? d. Construct a graph that best displays these data. Explain why the graph you selected is appropriate for these data. E-mail Hours per Week Frequency 19 20 1 13 2 2 4 6. 6. 2 8. 1 6. 23 10 or more 7.arrow_forward
- Consumer Reports rated automobile insurance companies and gave annual premiums for top-rated companies in several states. The figure below shows premiums for urban customers (married couple with one 17-year-old son) in three states. The box plots were all drawn using the same scale on a TI-8- Texas Pennsylvania California (a) Which state has the lowest premium? the highest? O lowest, California; highest, Texas O lowest, Texas; highest, Pennsylvania O lowest, Pennsylvania; highest, California lowest, California; highest, Pennsylvaniaarrow_forwardThe estimated labor cost associated with a particular proposal is based on the number of plantings of trees, shrubs, and so on to be used for the project. For cost-estimating purposes, managers use two hours of labor time for the planting of a medium-sized tree. Actual times from a sample of 10 plantings during the past month follow (times in hours). 1.6 1.5 2.6 2.3 2.5 2.3 2.6 3.0 1.3 2.3 What is the test statistic? (Round your answer to three decimal places.) What is the p-value? (Round your answer to four decimal places.) p-value =arrow_forward
arrow_back_ios
arrow_forward_ios
Recommended textbooks for you
- MATLAB: An Introduction with ApplicationsStatisticsISBN:9781119256830Author:Amos GilatPublisher:John Wiley & Sons Inc
 Probability and Statistics for Engineering and th...StatisticsISBN:9781305251809Author:Jay L. DevorePublisher:Cengage Learning
 Statistics for The Behavioral Sciences (MindTap C...StatisticsISBN:9781305504912Author:Frederick J Gravetter, Larry B. WallnauPublisher:Cengage Learning
  Elementary Statistics: Picturing the World (7th E...StatisticsISBN:9780134683416Author:Ron Larson, Betsy FarberPublisher:PEARSON
 The Basic Practice of StatisticsStatisticsISBN:9781319042578Author:David S. Moore, William I. Notz, Michael A. FlignerPublisher:W. H. Freeman
 Introduction to the Practice of StatisticsStatisticsISBN:9781319013387Author:David S. Moore, George P. McCabe, Bruce A. CraigPublisher:W. H. Freeman
MATLAB: An Introduction with Applications
Statistics
ISBN:9781119256830
Author:Amos Gilat
Publisher:John Wiley & Sons Inc
Probability and Statistics for Engineering and th...
Statistics
ISBN:9781305251809
Author:Jay L. Devore
Publisher:Cengage Learning
Statistics for The Behavioral Sciences (MindTap C...
Statistics
ISBN:9781305504912
Author:Frederick J Gravetter, Larry B. Wallnau
Publisher:Cengage Learning
Elementary Statistics: Picturing the World (7th E...
Statistics
ISBN:9780134683416
Author:Ron Larson, Betsy Farber
Publisher:PEARSON
The Basic Practice of Statistics
Statistics
ISBN:9781319042578
Author:David S. Moore, William I. Notz, Michael A. Fligner
Publisher:W. H. Freeman
Introduction to the Practice of Statistics
Statistics
ISBN:9781319013387
Author:David S. Moore, George P. McCabe, Bruce A. Craig
Publisher:W. H. Freeman