ENGR.ECONOMIC ANALYSIS
14th Edition
ISBN: 9780190931919
Author: NEWNAN
Publisher: Oxford University Press
expand_more
expand_more
format_list_bulleted
Question

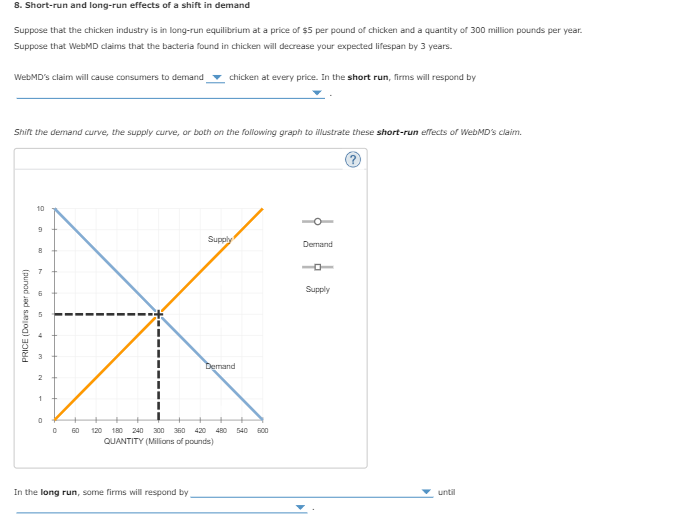
Transcribed Image Text:8. Short-run and long-run effects of a shift in demand
Suppose that the chicken industry is in long-run equilibrium at a price of $5 per pound of chicken and a quantity of 300 million pounds per year.
Suppose that WebMD claims that the bacteria found in chicken will decrease your expected lifespan by 3 years.
chicken at every price. In the short run, firms will respond by
WebMD's claim will cause consumers to demand
Shift the demand curve, the supply curve, or both on the following graph to illustrate these short-run elffects or WEBMD's claim.
10
Supply
Demand
Supply
Demand
60
120
180
240 300 300
420
480
540
600
QUANTITY (Millions of pounds)
In the long run, some firms will respond by
until
PRICE (Dolars per pound)

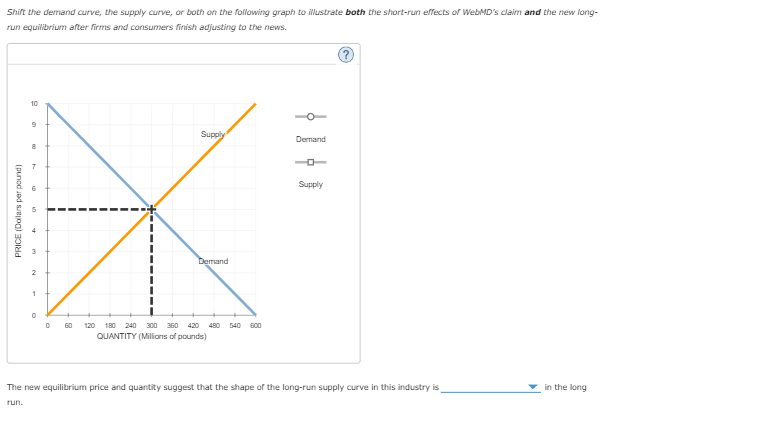
Transcribed Image Text:Shift the demand curve, the supply curve, or both on the following graph to illustrate both the short-run effects of WEDMD's claim and the new long-
run equilibrium after firms and consumers finish adjusting to the news.
10
Supply
Dermand
Supply
31
Demand
60
120
180 240 30 360 420 480
540
600
QUANTITY (Millions of pounds)
The new equilibrium price and quantity suggest that the shape of the long-run supply curve in this industry is
in the long
run.
(punod Jed sJBJog) zOIHd
Expert Solution
This question has been solved!
Explore an expertly crafted, step-by-step solution for a thorough understanding of key concepts.
This is a popular solution
Trending nowThis is a popular solution!
Step by stepSolved in 2 steps

Knowledge Booster
Similar questions
- # For a firm, the supply curve is given to be as:- 2P - 30 = Q And the demand curve is give to be as:- 15 - P = Q Calculate the equilibrium price and equilibrium Quantityarrow_forwardThere are two attachments belowarrow_forwardSuppose production is reduced by 60 percent for each of the suppliers in this industry. Draw a new market curve and answer the following questions based on your new supply curve and the original demand curve. In Table 3.1, the equilibrium market quantity would be Table 3,3 Individual Demand and Supply Schedules. Quantity Demanded By: Price 4.00 Ali Kelly Jessie Market 4 1 3.00 8 2.00 12 1.00 16 3.00 10 2.00 5 1.00 0 17 units Quantity Supplied by: Price Andy Maria Jose Market 4.00 15 15 11 9 7 5 12 units 25 units 9746 10 units 2 1234 11 7 3arrow_forward
- Starting from an equilibrium condition, consider an increase in income in a perfectly com-petitive market with a normal good. (a) Draw the MC, ATC and price level on the same graph before and after the change in income. (b) What will happen to the number of firms in the long-run? (c) If the number of firms change, what will happen to the short-run supply curve? (d) What’s the long-run production and price level. (e) Draw the long-run supply curve.arrow_forwardThis problem continues from the previous one. On the graph the supply in the Rest of the World has shifted from Sstart to S2 and the market in the Rest of the World has moved to a new short run equilibrium at B. The price of Good A is P1 in the U.S. and P2 in the Rest of the World. Which answer choices are correct from the image bellow?arrow_forwardGeneral Electric (GE) produces wind turbines that generate wind power. Over the past 10 years, the advances in technology used to produce wind turbines has resulted in O GE increasing the quantity supplied of wind turbines. a decrease in the supply of wind-generated power. a rightward shift in the supply curve for wind-generated power. a movement up along the supply curve for wind-generated power.arrow_forward
arrow_back_ios
arrow_forward_ios
Recommended textbooks for you

 Principles of Economics (12th Edition)EconomicsISBN:9780134078779Author:Karl E. Case, Ray C. Fair, Sharon E. OsterPublisher:PEARSON
 Engineering Economy (17th Edition)EconomicsISBN:9780134870069Author:William G. Sullivan, Elin M. Wicks, C. Patrick KoellingPublisher:PEARSON
 Principles of Economics (MindTap Course List)EconomicsISBN:9781305585126Author:N. Gregory MankiwPublisher:Cengage Learning
 Managerial Economics: A Problem Solving ApproachEconomicsISBN:9781337106665Author:Luke M. Froeb, Brian T. McCann, Michael R. Ward, Mike ShorPublisher:Cengage Learning
 Managerial Economics & Business Strategy (Mcgraw-...EconomicsISBN:9781259290619Author:Michael Baye, Jeff PrincePublisher:McGraw-Hill Education


Principles of Economics (12th Edition)
Economics
ISBN:9780134078779
Author:Karl E. Case, Ray C. Fair, Sharon E. Oster
Publisher:PEARSON

Engineering Economy (17th Edition)
Economics
ISBN:9780134870069
Author:William G. Sullivan, Elin M. Wicks, C. Patrick Koelling
Publisher:PEARSON

Principles of Economics (MindTap Course List)
Economics
ISBN:9781305585126
Author:N. Gregory Mankiw
Publisher:Cengage Learning

Managerial Economics: A Problem Solving Approach
Economics
ISBN:9781337106665
Author:Luke M. Froeb, Brian T. McCann, Michael R. Ward, Mike Shor
Publisher:Cengage Learning

Managerial Economics & Business Strategy (Mcgraw-...
Economics
ISBN:9781259290619
Author:Michael Baye, Jeff Prince
Publisher:McGraw-Hill Education