MATLAB: An Introduction with Applications
6th Edition
ISBN: 9781119256830
Author: Amos Gilat
Publisher: John Wiley & Sons Inc
expand_more
expand_more
format_list_bulleted
Question
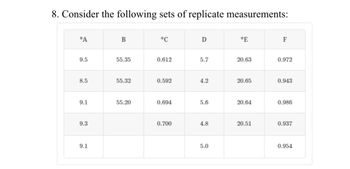
For each set calculate the standard deviation and the coefficient of variation

Transcribed Image Text:8. Consider the following sets of replicate measurements:
*A
9.5
8.5
9.1
9.3
9.1
B
55.35
55.32
55.20
*C
0.612
0.592
0.694
0.700
D
5.7
4.2
5.6
4.8
5.0
*E
20.63
20.65
20.64
20.51
F
0.972
0.943
0.986
0.937
0.954
Expert Solution
arrow_forward
Step 1
Introduction:
It is required to obtain the standard deviation and coefficient of variation for the given datasets.
Step by stepSolved in 2 steps with 9 images

Knowledge Booster
Similar questions
- For the residents in 2014, use R to calculate the interval with 99% certainty that the interval contains the actual population mean of the residents by census tracts. Type in the interval with keyboard. We also know that in each year, the number of residents by census tract in the State of Maryland follows a normal distribution, and the variance in the number of residents within the State of Maryland is the same for different years. POP2014: 3072, 1989, 3794, 2689, 3211, 3722, 4385, 4009, 7598, 3862, 3097, 2726, 4881, 4157, 2570, 2512, 2518, 4863, 4147, 7139, 6067, 6819, 3705, 3239, 3824, 4977, 2576, 2940, 9791, 5231, 5634, 5337, 4205, 3888, 5562, 3335, 3770, 1808, 2045, 1532, 5420, 4993, 6109, 4377, 5424, 4976, 4507, 3738, 2827, 3485, 1559, 5199, 4702, 3971, 3803, 3356, 4670, 3816, 5477, 4760, 3126, 3630, 3755, 3795, 2578, 3382, 4005, 2442, 6096, 3799, 3843, 3836, 6046, 6431, 3561, 3142, 4829, 5058, 2471, 6119, 3523, 3094, 3146, 3356, 2618, 2366, 4266, 4016, 6080, 1554, 6878, 3645,…arrow_forwardAssume time to failure density function (in months) of transplanted kidneys has a Weibull distribution with shape factor of 3 and scale of 6. Use R and answer the following questions (enter your answers with 3 decimal points):arrow_forwardFind the mean and standard deviation for each Poisson: a. A = 6 (Round your standard deviation to 3 decimal places.) Mean Standard deviation b. A = 18 (Round your standard deviation to 3 decimal places.) Mean Standard deviation c. A = 3 (Round your standard deviation to 3 decimal places.) Mean Standard deviationarrow_forward
- Assume that the distribution of scores on a college entrance exam is normally distributed with a mean of 490 and a standard deviation of 43. For each score in the table below, convert the raw score into a corresponding z-score. original score Z-score 621 398 586 710arrow_forwardSuppose baby kittens' weights are normally distributed with a mean of 11.4 and a standard deviation of 2.1. The Z-score tells you how many units above the average (if Z-score is positive) or below the average (if Z- Score is negative) any particular baby kitten's weight is. Find the baby kitten weight that corresponds to the following Z-scores. Use the formula Z where u is the mean, o is the standard deviation, and X is the baby kitten weight. a. Z = = 0.07, X = b. Z = 1.63, X =arrow_forwardAssume that the readings on the thermometers are normally distributed with a mean of 0° and standard deviation of 1.00°C. A thermometer is randomly selected and tested. Draw a sketch and find the temperature reading corresponding to P34, the 84th percentile. This is the temperature reading separating the bottom 84% from the top 16%. Click to view page 1 of the table. Click to view page 2 of the table. Which graph represents P ? Choose the correct graph below. 84 A. В. OC. D. Ay X The temperature for P84 is approximately (Round to two decimal places as needed.)arrow_forward
arrow_back_ios
arrow_forward_ios
Recommended textbooks for you
 MATLAB: An Introduction with ApplicationsStatisticsISBN:9781119256830Author:Amos GilatPublisher:John Wiley & Sons Inc
 Probability and Statistics for Engineering and th...StatisticsISBN:9781305251809Author:Jay L. DevorePublisher:Cengage Learning
 Statistics for The Behavioral Sciences (MindTap C...StatisticsISBN:9781305504912Author:Frederick J Gravetter, Larry B. WallnauPublisher:Cengage Learning
 Elementary Statistics: Picturing the World (7th E...StatisticsISBN:9780134683416Author:Ron Larson, Betsy FarberPublisher:PEARSON
 The Basic Practice of StatisticsStatisticsISBN:9781319042578Author:David S. Moore, William I. Notz, Michael A. FlignerPublisher:W. H. Freeman
 Introduction to the Practice of StatisticsStatisticsISBN:9781319013387Author:David S. Moore, George P. McCabe, Bruce A. CraigPublisher:W. H. Freeman

MATLAB: An Introduction with Applications
Statistics
ISBN:9781119256830
Author:Amos Gilat
Publisher:John Wiley & Sons Inc

Probability and Statistics for Engineering and th...
Statistics
ISBN:9781305251809
Author:Jay L. Devore
Publisher:Cengage Learning

Statistics for The Behavioral Sciences (MindTap C...
Statistics
ISBN:9781305504912
Author:Frederick J Gravetter, Larry B. Wallnau
Publisher:Cengage Learning

Elementary Statistics: Picturing the World (7th E...
Statistics
ISBN:9780134683416
Author:Ron Larson, Betsy Farber
Publisher:PEARSON

The Basic Practice of Statistics
Statistics
ISBN:9781319042578
Author:David S. Moore, William I. Notz, Michael A. Fligner
Publisher:W. H. Freeman

Introduction to the Practice of Statistics
Statistics
ISBN:9781319013387
Author:David S. Moore, George P. McCabe, Bruce A. Craig
Publisher:W. H. Freeman