
MATLAB: An Introduction with Applications
6th Edition
ISBN: 9781119256830
Author: Amos Gilat
Publisher: John Wiley & Sons Inc
expand_more
expand_more
format_list_bulleted
Related questions
Question
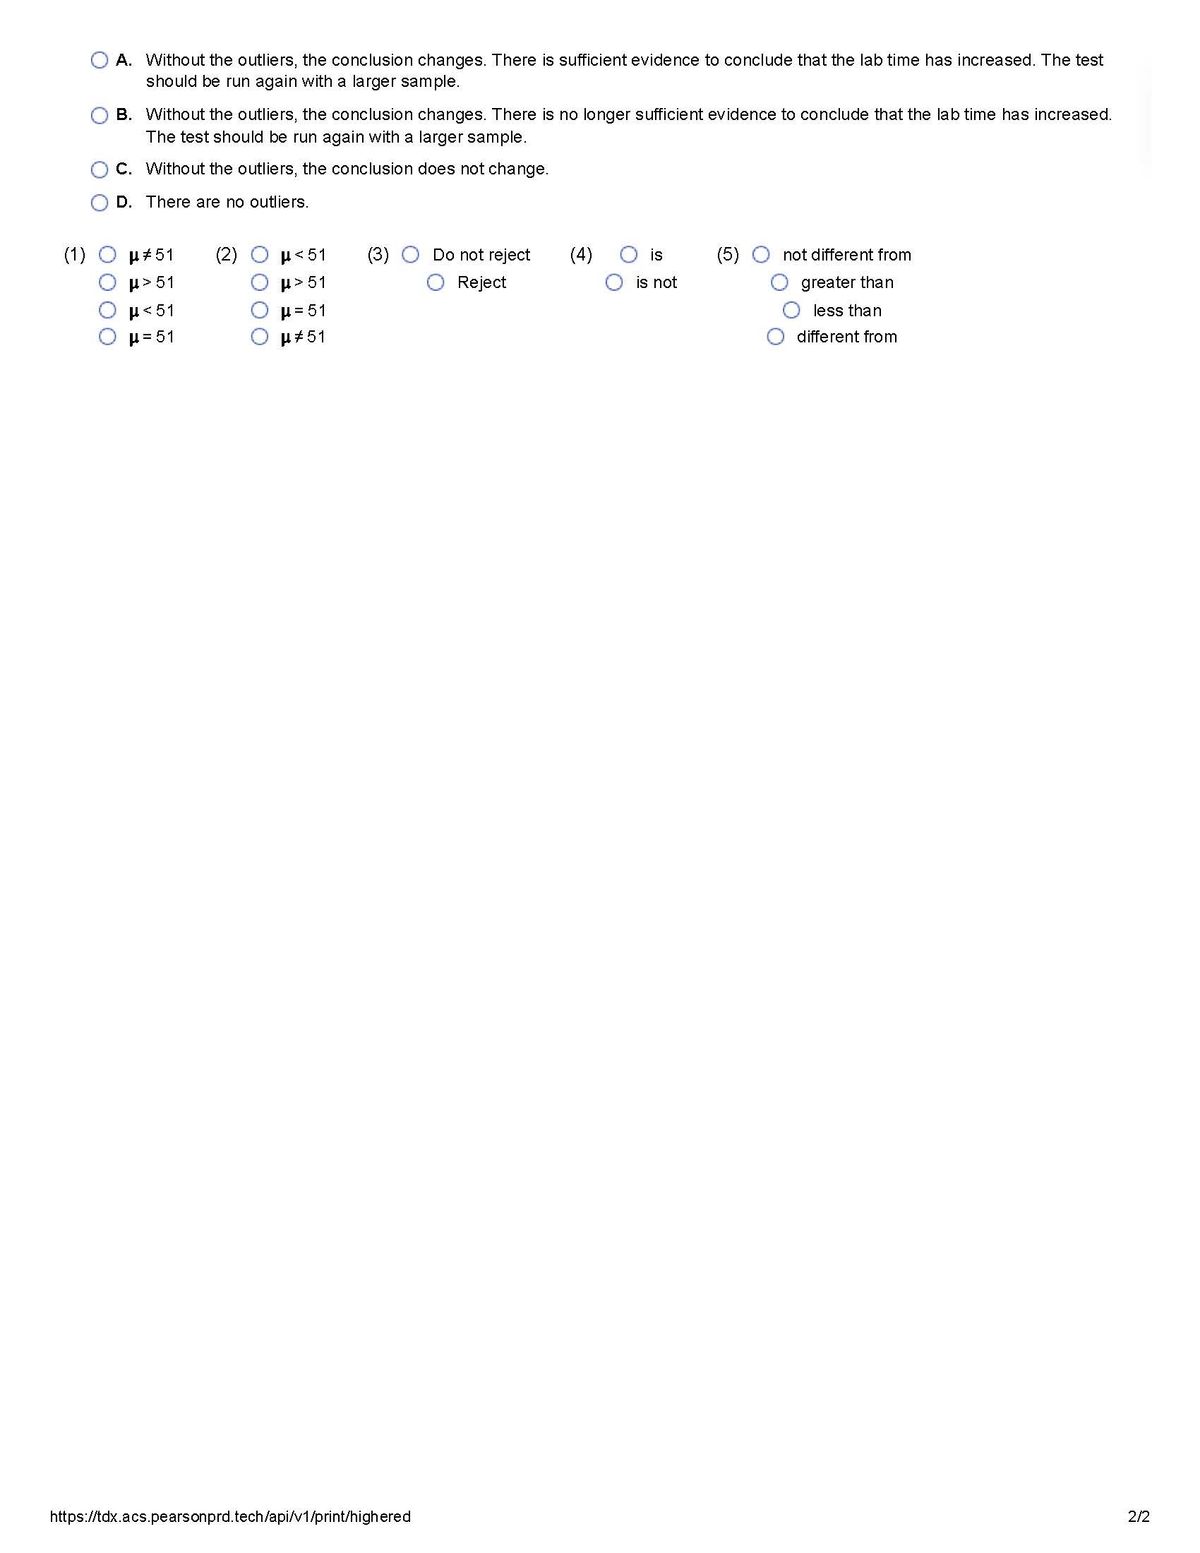

Transcribed Image Text:A. Without the outliers, the conclusion changes. There is sufficient evidence to conclude that the lab time has increased. The test
should be run again with a larger sample.
B. Without the outliers, the conclusion changes. There is no longer sufficient evidence to conclude that the lab time has increased.
The test should be run again with a larger sample.
C. Without the outliers, the conclusion does not change.
D. There are no outliers.
(1)
#51
μ>51
(2)
με 51
(3)
Do not reject
(4)
is
(5)
not different from
H>51
Reject
is not
με 51
μ = 51
H=51
μ#51
greater than
less than
different from
https://tdx.acs.pearsonprd.tech/api/v1/print/highered
2/2

Transcribed Image Text:8. Atechnology committee wants to perform a test to see if the mean amount of time students are spending in a lab
has increased from 51 minutes. Here are the data from a random sample of 12 students.
a) Plot the data. Are any of the observations outliers? Explain.
b) What do you conclude about the claim? If there are outliers, perform the test with and without the outliers
present.
a) Choose the correct histogram of the data below.
A.
0
160
Time (min.)
B.
160
Time (min.)
○ C.
D.
0
160
Time (min.)
Are there any outliers? Select the correct choice below and fill in any answer boxes within your choice.
A. There are no outliers. All of the points are grouped together in the histogram.
B. There are
53
57
55
76
62
ཀྲུག=
Time (min.)
73
54
137
72
52
63
0
160
Time (min.)
outliers, because those points are significantly different from the rest of the data.
b) Write appropriate hypotheses for the test.
Ho (1)
HA (2)
The test statistic is t=
(Round to two decimal places as needed.).
The P-value is
(Round to three decimal places as needed.)
State your conclusion for the given data set. Use a 0.05.
the null hypothesis. There (4)
the previous value.
sufficient evidence to conclude that the mean time spend in the lab is
If there are outliers, calculate the test statistic for the data set without outliers. Select the correct choice below and fill in any answer boxes
within your choice.
OA. The test statistic is t=
(Round to two decimal places as needed.)
B. There are no outliers.
If there are outliers, calculate the P-value statistic for the data set without outliers. Select the correct choice below and fill in any answer
boxes within your choice.
OA. The P-value is
(Round to three decimal places as needed.)
B. There are no outliers.
If there are outliers, how does this affect the conclusion?
https://tdx.acs. pearsonprd.tech/api/v1/print/highered
1/2
Expert Solution
This question has been solved!
Explore an expertly crafted, step-by-step solution for a thorough understanding of key concepts.

This is a popular solution

Trending nowThis is a popular solution!

Step by stepSolved in 5 steps with 24 images

Knowledge Booster

Similar questions
- Students in a statistics class were asked, “About how many minutes do you typically exercise in aweek?” Responses from the men in the class were “180, 300, 60, 480, 0, 90, 300, 14, 600, 360, 120, 0,240”(a) Create a five-number summary of the men’s responses.(b) Identify any potential outliers.arrow_forwardHere is a random sample of 20 Target Store shoppers and the number of items purchased: 32, 11, 45, 17, 35, 8, 42, 24, 13, 46, 23, 19, 14, 15, 36, 23, 8, 32, 16, 39 Construct an ordered Stem and Leaf plot by hand using your pencil and paper. In the essay text box, type in the leaf values that are on your stem for 3 (30's).arrow_forwardFrom the set of numbers 10,17,19,20,22 The mean is 17.6 Median is 19 Mode is no mode. make 1st, 2nd, and 3rd quartiles, then sketch a box and whisper plot.arrow_forward
- Department of Education was analysing the average mathematics test score in the schools in Victoria. It noticed that there were dramatic differences in scores among the schools. In the attempt to improve the scores of all the schools, department attempted to determine the factors that account for the differences. Accordingly, they took a random sample of 40 schools across the state and for each determined the mean test score last year, the percentage of teachers in the schools who have at least one university degree in mathematics, the mean age and the mean annual income of the mathematics teachers. The following is regression output from Excel. SUMMARY OUTPUT Regression Statistics Multiple R 0.597512 R Square 0.357021 Adjusted R Square 0.303439 Standard Error 7.724526 Observations 40 ANOVA df SS MS F Significance F…arrow_forwardA person is interested in studying the amount of time (in minutes ) people spend on social media in a day. The following data is collected from a sample of 12 people : 45, 60,25,55,75,90,100,120,105,80, 0 and 220. Does the data contain outlier(s)? Explain your reasoning. ( use empirical rule and use the quartile method to check ).arrow_forwardFor a box plot, here are 4 values at the low end of a dataset and 4 values near the high end of a set of dataset: 18, 18, 18, 18 ... 23, 23, 25, 25, ... If the lower fence or boundary for outlier determination is 16 and the upper fence or boundary is 24, what value would you connect the whisker to on the high side of the "box?"arrow_forward
- An athletic shoemaker wants to test if their new running shoe specially made for sprinting is better than the competition. To do this, they recruit 35 NCAA sprinters and time their 100-meter dash wearing the company's shoe and then time their 100-meter dash again wearing the competitor’s shoe. The difference of these times is then calculated asTimecompany.shoe−Timecompetitor.shoe. The sample mean difference in times is 0.53 seconds and the sample standard deviation is 1.1. Conduct a hypothesis test at theα=0.1 level. (a) Set up the null and alternative hypothesis (using mathematical notation/numbers AND interpret them in the context of the problem) (b) Calculate the test statistic (c) Calculate the critical value. (d) Draw a picture of the distribution of the test statistic underH0. Label and provide values for the critical value and the test statistic, and shade the critical region. (e) Make and justify a statistical decision at theα= 0.15 level and state your conclusions in the…arrow_forwardDetermine the mean of math proficiency scores of students taught by the Standard Method. Determine the median of math proficiency scores of students taught by the New Method. Determine the median of math proficiency scores of students taught by the Standard Method. Determine the mean of math proficiency scores of students taught by the New Method.arrow_forward
arrow_back_ios
arrow_forward_ios
Recommended textbooks for you
- MATLAB: An Introduction with ApplicationsStatisticsISBN:9781119256830Author:Amos GilatPublisher:John Wiley & Sons Inc
 Probability and Statistics for Engineering and th...StatisticsISBN:9781305251809Author:Jay L. DevorePublisher:Cengage Learning
 Statistics for The Behavioral Sciences (MindTap C...StatisticsISBN:9781305504912Author:Frederick J Gravetter, Larry B. WallnauPublisher:Cengage Learning
  Elementary Statistics: Picturing the World (7th E...StatisticsISBN:9780134683416Author:Ron Larson, Betsy FarberPublisher:PEARSON
 The Basic Practice of StatisticsStatisticsISBN:9781319042578Author:David S. Moore, William I. Notz, Michael A. FlignerPublisher:W. H. Freeman
 Introduction to the Practice of StatisticsStatisticsISBN:9781319013387Author:David S. Moore, George P. McCabe, Bruce A. CraigPublisher:W. H. Freeman
MATLAB: An Introduction with Applications
Statistics
ISBN:9781119256830
Author:Amos Gilat
Publisher:John Wiley & Sons Inc
Probability and Statistics for Engineering and th...
Statistics
ISBN:9781305251809
Author:Jay L. Devore
Publisher:Cengage Learning
Statistics for The Behavioral Sciences (MindTap C...
Statistics
ISBN:9781305504912
Author:Frederick J Gravetter, Larry B. Wallnau
Publisher:Cengage Learning
Elementary Statistics: Picturing the World (7th E...
Statistics
ISBN:9780134683416
Author:Ron Larson, Betsy Farber
Publisher:PEARSON
The Basic Practice of Statistics
Statistics
ISBN:9781319042578
Author:David S. Moore, William I. Notz, Michael A. Fligner
Publisher:W. H. Freeman
Introduction to the Practice of Statistics
Statistics
ISBN:9781319013387
Author:David S. Moore, George P. McCabe, Bruce A. Craig
Publisher:W. H. Freeman