
MATLAB: An Introduction with Applications
6th Edition
ISBN: 9781119256830
Author: Amos Gilat
Publisher: John Wiley & Sons Inc
expand_more
expand_more
format_list_bulleted
Related questions
Question
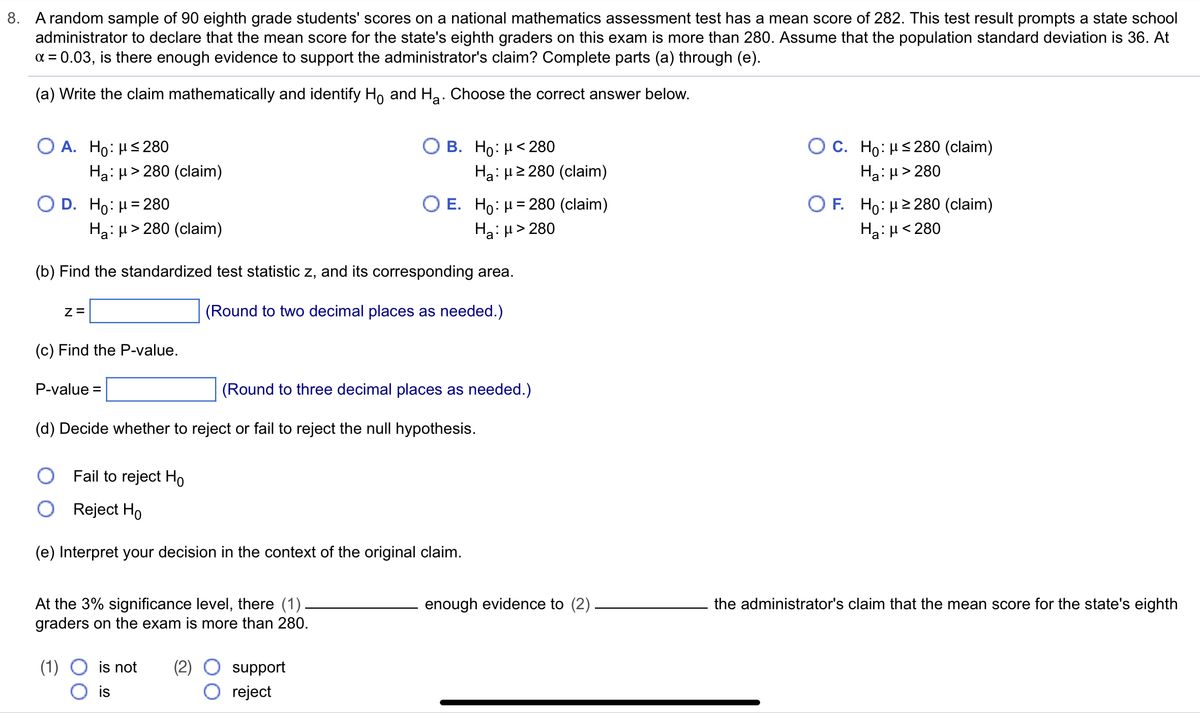

Transcribed Image Text:8. A random sample of 90 eighth grade students' scores on a national mathematics assessment test has a mean score of 282. This test result prompts a state school
administrator to declare that the mean score for the state's eighth graders on this exam is more than 280. Assume that the population standard deviation is 36. At
α = 0.03, is there enough evidence to support the administrator's claim? Complete parts (a) through (e).
(a) Write the claim mathematically and identify Ho and H₂. Choose the correct answer below.
O A. Ho: μ≤280
Ha: μ> 280 (claim)
O D. Ho: μ = 280
Z=
(c) Find the P-value.
Ha: μ> 280 (claim)
(b) Find the standardized test statistic z, and its corresponding area.
(Round to two decimal places as needed.)
P-value=
B. Ho: μ< 280
At the 3% significance level, there (1)
graders on the exam is more than 280.
(1) O is not (2)
O is
Ha: μ ≥280 (claim)
O E. Ho: μ = 280 (claim)
Ha:μ> 280
(Round to three decimal places as needed.)
(d) Decide whether to reject or fail to reject the null hypothesis.
Fail to reject Ho
Reject Ho
(e) Interpret your decision in the context of the original claim.
support
reject
enough evidence to (2)
O C. Ho: μ≤280 (claim)
Ha:μ> 280
OF. Ho: μ ≥280 (claim)
Ha:μ< 280
the administrator's claim that the mean score for the state's eighth
Expert Solution
This question has been solved!
Explore an expertly crafted, step-by-step solution for a thorough understanding of key concepts.

This is a popular solution

Trending nowThis is a popular solution!

Step by stepSolved in 5 steps with 1 images

Knowledge Booster

Similar questions
- 3. The average (or mean) amount of hours spent on social media per day is 2 hours and the standard deviation is 2 hours. Calculate the z scores for the following individual scores: Person 1 (X) = 1 hour, z = Person 2 (X) = 3 hours, z= Person 3 (X) = 4 hours, z=arrow_forwardPls. answer all the given questions with solutions. will upvote if complete, thanks!arrow_forwardUse z scores to compare the given values. The tallest living man at one time had a height of 238 cm. The shortest living man at that time had a height of 142.4 cm. Heights of men at that time had a mean of 175.45 cm and a standard deviation of 5.59 cm. Which of these two men had the height that was more extreme? ... Since the z score for the tallest man is z = 0 and the z score for the shortest man is z = the man had the height that was Im- more extreme. (Round to two decimal places.) shortest tallestarrow_forward
arrow_back_ios
arrow_forward_ios
Recommended textbooks for you
- MATLAB: An Introduction with ApplicationsStatisticsISBN:9781119256830Author:Amos GilatPublisher:John Wiley & Sons Inc
 Probability and Statistics for Engineering and th...StatisticsISBN:9781305251809Author:Jay L. DevorePublisher:Cengage Learning
 Statistics for The Behavioral Sciences (MindTap C...StatisticsISBN:9781305504912Author:Frederick J Gravetter, Larry B. WallnauPublisher:Cengage Learning
  Elementary Statistics: Picturing the World (7th E...StatisticsISBN:9780134683416Author:Ron Larson, Betsy FarberPublisher:PEARSON
 The Basic Practice of StatisticsStatisticsISBN:9781319042578Author:David S. Moore, William I. Notz, Michael A. FlignerPublisher:W. H. Freeman
 Introduction to the Practice of StatisticsStatisticsISBN:9781319013387Author:David S. Moore, George P. McCabe, Bruce A. CraigPublisher:W. H. Freeman
MATLAB: An Introduction with Applications
Statistics
ISBN:9781119256830
Author:Amos Gilat
Publisher:John Wiley & Sons Inc
Probability and Statistics for Engineering and th...
Statistics
ISBN:9781305251809
Author:Jay L. Devore
Publisher:Cengage Learning
Statistics for The Behavioral Sciences (MindTap C...
Statistics
ISBN:9781305504912
Author:Frederick J Gravetter, Larry B. Wallnau
Publisher:Cengage Learning
Elementary Statistics: Picturing the World (7th E...
Statistics
ISBN:9780134683416
Author:Ron Larson, Betsy Farber
Publisher:PEARSON
The Basic Practice of Statistics
Statistics
ISBN:9781319042578
Author:David S. Moore, William I. Notz, Michael A. Fligner
Publisher:W. H. Freeman
Introduction to the Practice of Statistics
Statistics
ISBN:9781319013387
Author:David S. Moore, George P. McCabe, Bruce A. Craig
Publisher:W. H. Freeman