8. (11 point.) A factory produces gadgets and generates pollution that causes $50 worth of damage per unit produced. The marginal private cost (MPC) of producing a gadget is given by the equation MPC = 20 + 0.5Q, where Q is the quantity of gadgets produced. The demand for gadgets is given by P = 100-Q, where P is the per-unit price of gadgets. Calculate the socially optimal quantity of gadgets produced.
Q: Draw the following isoquants: a. In the production of chips, three machines and one person can…
A: 5-step explanation of the solution: Part (a): Production of ChipsStep 1: Identify the given…
Q: David and Morgan are farmers. Each one owns a 14-acre plot of land. The following table shows the…
A: This problem involves several key concepts: Production Possibilities Frontier (PPF): The production…
Q: 13. (Use this information to answer qustion 13 - 16) Suppose a household solves the following…
A: Let's go through the questions step-by-step.Question 16
Q: SECTION B: MACROECONOMICS QUESTION 3 The mandate of the South African Reserve Bank (SARB) is to…
A: The money transmission mechanism is the process through which changes in the monetary policy (in…
Q: help please answer in text form with proper workings and explanation for each and every part and…
A: When analyzing the effects of China's decision to end its one-child policy, an economist would…
Q: 4. A P1 B P2 L K Po P M N F G H Qo Q1 Q2 MSC MPC+t MPC D=MPB Quantity Suppose the figure above shows…
A: Part a) Complete the table by labeling the respective areas.Consumer SurplusBefore tax: Consumer…
Q: help please answer in text form with proper workings and explanation for each and every part and…
A: Expelling Iraq from Kuwait (Gulf War, 1990-1991)This option is correct because most Americans…
Q: Give exact answer without photo answer and take a like
A: To analyze the determinants behind the saving-investment balance developments in Turkey over the…
Q: I need answer typing clear urjent no chatgpt used i will give upvotes
A:
Q: Your Question :Your Question :Your Question :Your Question :help please answer in text form with…
A: a. Given:- Monthly demand = 9,000 boxes- Working days per year = 300 days- Unit price (box) =…
Q: In the attached graphic, the slope of the PPF between J-20 and J=30 is Graphic for Q4 to Q6 10 O-2…
A: Coordinates:J = 20, y-axis value = 34J = 30, y-axis value = 32 Changes:ΔX (change in J) = 30 - 20 =…
Q: Suppose there exist two imaginary countries, Everglades and Yosemite. Their labor forces are each…
A: Step 2: Specialization and ProductionEverglades specializes in pistachios:Total labor hours = 4…
Q: Macmillan Learning Suppose Ralph own a chicken processing plant with the total cost function shown…
A: 1. Determine Ralph's Fixed Cost: The fixed cost is the cost incurred when no output is produced…
Q: Question 4 Using AD\ AS model, show how the fiscal policy work in case of recession.
A: The Aggregate Demand-Aggregate Supply (AD-AS) model is a fundamental tool in macroeconomics used to…
Q: Rival in consumption is another term for rivalrous. a)A sports team t-shirt b)The air we breathe…
A: In economics, a good or service is considered rival in consumption (or rivalrous) if its consumption…
Q: Using the following table, calculate the missing exchange rates: Country Currency Price of one unit…
A:
Q: What might be the unintended consequences of such an attempt to either limit the accumulation of…
A: What might be the unintended consequences of taxing the wealthy at higher rates as warned by…
Q: Which component(s) had a positive contribution to growth in each quarter? Choose one or more: A.…
A: Step 1:Question 1:Which component(s) had a positive contribution to growth in each quarter?To answer…
Q: Freedonia has a comparative advantage in the production of production of ' , while Lamponia has a…
A: In economics, the concept of comparative advantage refers to the ability of a party (an individual,…
Q: None
A: Step 1:PlayerAdvice UtilityAPromote1BRejects as lowest utility2CFire as highest utility3FinalFire…
Q: help please answer in text form with proper workings and explanation for each and every part and…
A: Marginal product of labor (MPL in short) gives us the productivity of the newly hired worker. It is…
Q: None
A: part b:
Q: do fast.
A: The price elasticity of demand measures the responsiveness of the quantity demanded of a good to a…
Q: help please answer in text form with proper workings and explanation for each and every part and…
A: Option a: This option is incorrect because deflation refers to the decrease in the general price…
Q: Given the productivity function, P(L, K) 23L0.35K0.65, find the following: = A) Find the marginal…
A: Given the productivity function P(L, K) = 23L0.35K0.65, we need to find the marginal productivity…
Q: Use the information given in North Central National Bank's balance sheet to answer the following…
A: To answer the questions based on the provided balance sheet of North Central National Bank, let's…
Q: help please answer in text form with proper workings and explanation for each and every part and…
A: Step 1: Debt outstanding, FV = $12.6 million FV = 12,600,000 Coupon rate = 5.9% m = Number of…
Q: help please answer in text form with proper workings and explanation for each and every part and…
A: step-by-Step SolutionBudget Constraints:Alice and Barbara each have $50.Alice spends $20 on cookies,…
Q: None
A: To calculate the marginal cost of the sixth unit of output, we need to determine the difference in…
Q: Please provide steps by step answer with proper explanation with final answer
A: Let's analyze and solve the given statement step-by-step.The given statement to complete…
Q: rio.com/secured@lockdown -d: Mid-Term Exam Question 13 Proctoring Er. O K Required information The…
A: Step 1:
Q: help please answer in text form with proper workings and explanation for each and every part and…
A: Detailed explanation:The correct answer is:b. costs from freer trade are highly concentrated, while…
Q: help please answer in text form with proper workings and explanation for each and every part and…
A: a. A rise in stock market values: An increase in stock market values typically leads to higher…
Q: None
A: Part 2: Explanation:Step 1: Identifying players and actions: Players: A, B, C (members of the…
Q: Pls help ASAP
A: Liability Loss from Uninsured Parked Trailer: When a liability loss occurs due to an uninsured…
Q: help please answer in text form with proper workings and explanation for each and every part and…
A: Given the production function,P(L,K)=28L0.3K0.7 We are going to solve for the following,Marginal…
Q: Owleodoxkxmmasw
A: Given:A considers the officer to have been a victim of bad luck, not bad judgment, and wants to go…
Q: Don't use ai to answer I will report your answer... Solve it Asap with explanation and all steps..
A:
Q: Pls help ASAP
A: Step 1: In the scenario provided, Jim's auto policy will likely respond in the following way:C)…
Q: help please answer in text form with proper workings and explanation for each and every part and…
A: A country import only the amount of quantity of good which the sellers in the economy fall short to…
Q: dont need steps just answer
A: A supply curve derived from the cost functions is in two-partsThe price should be greater than the…
Q: help please answer in text form with proper workings and explanation for each and every part and…
A: Part 1: Change in Demand vs. Change in Quantity DemandedA change in demand is represented by a shift…
Q: help please answer in text form with proper workings and explanation for each and every part and…
A: GIVEN:Profit margin =10% = 0.10D/E =1.5ROE=20%=0.20asset=$200 Step 1First, we will calculate the…
Q: Refer to the accompanying figure. 10 S Price ($) 00 6 4 2 0 0 4 D 00 12 16 20 Quantity If this…
A: Step 1:Step 2: Step 3: Step 4:
Q: None
A: Step 1: IntroductionIn this scenario, the factor market and the product market can be identified as…
Q: None
A: Step 1:Nominal Interest (r) = 12%,No. of interest period (m) = 12 Step 2:R = 12%, M = 12;i/yr = (1+…
Q: Answer the question on the basis of the following cost data. Average Fixed Average Variable Output…
A: We have to determine the total cost unit of 5 and 6 Total cost of 5th unit = 5 x (10 + 68) =…
Q: help please answer in text form with proper workings and explanation for each and every part and…
A: The image presents a model of the labor market with the following equations:Labor supply:…
Q: Don't use ai to answer I will report your answer. Solve it Asap with explanation and calculation
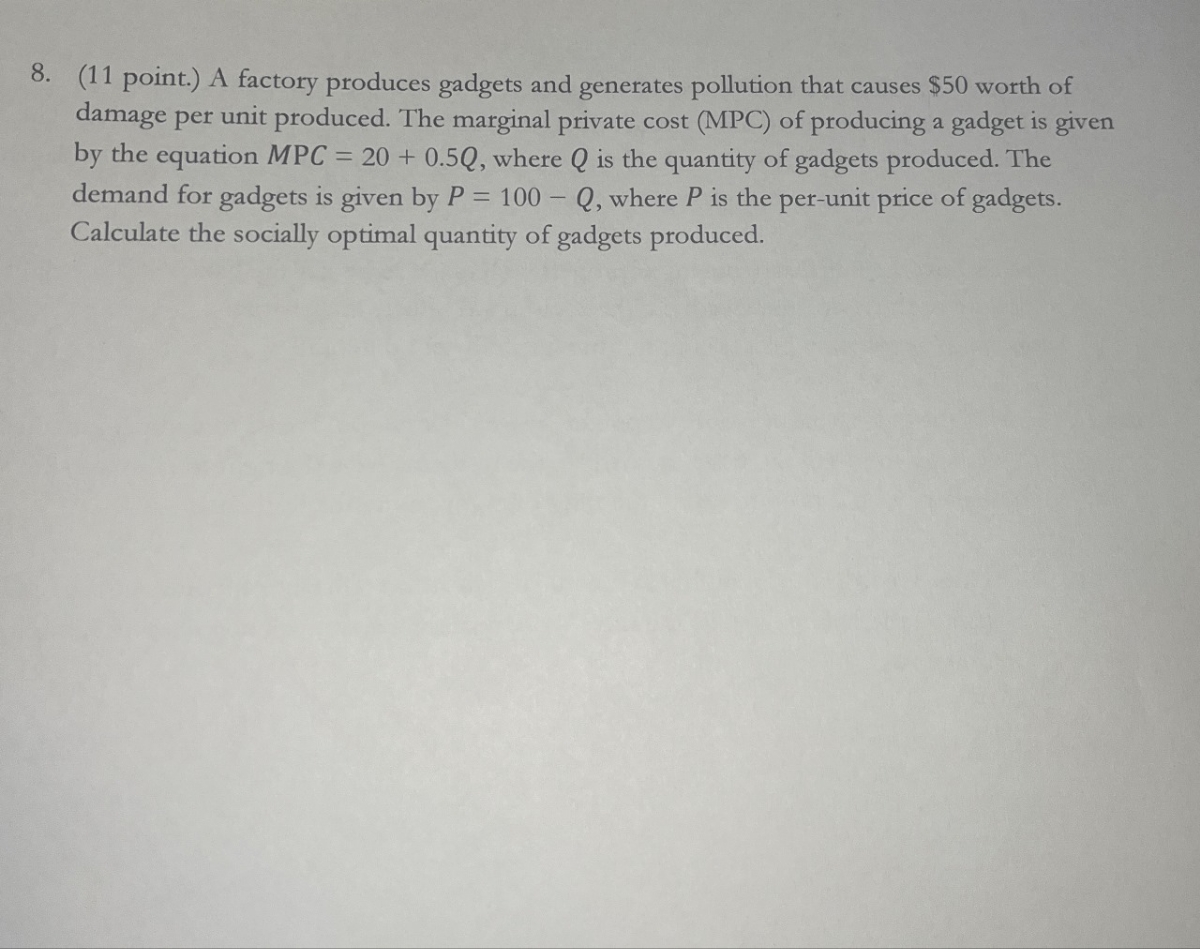
A: Step 1:Calculating the Present Worth of Increasing Maintenance CostsIdentify the variables:Initial…
Q: Please describe a shadow bank/define shadow banking and explain why thesefinancial institutions pose…
A: Financial intermediaries and activities that operate outside of the regular banking system and are…
Step by step
Solved in 2 steps with 1 images
- Q4. (a) If you are a firm owner who is operating in the perfect competitive market, you areproducing socially efficient outcome. Does it imply that your profits are zero? If you become amonopolist then why do you deviate from the socially efficient outcome? b) In Delhi, as the winter season is approaching, how will it affect the demand function and themarket equilibrium of sweater market? Now after that if the price of wool increases how will themarket equilibrium be affected?2. Efficiency in the presence of externalities Trucks impose many external costs on society: heavy air and noise pollution, traffic safety issues and road congestion, and so on. Therefore, the market equilibrium quantity of diesel trucks does not equal the socially optimal quantity. The following graph plots the demand for diesel trucks (their private value), the supply of diesel trucks (the private cost of producing them), and the social cost of diesel trucks, including both the private cost and external costs. Use the black point (plus symbol) to indicate the market equilibrium quantity. Next, use the purple point (diamond symbol) to indicate the socially optimal quantity. PRICE OF DIESEL TRUCKS Social Cost Supply (Private Cost) Demand (Private Value) QUANTITY OF DIESEL TRUCKS + Market Equilibrium ■ Socially Optimal Level ?1. Solve for the graph and aggregate demand of the city’s 30 residents as functions of the number of trees. Label intercepts slopes and intersection of two sections. 2. Assume that the city can obtain each tree at a constant marginal cost of 200. Solve the socially efficient numbers of trees for the city to purchase.
- 2. Efficiency in the presence of externalities Fireworks impose many external costs on society: noise pollution, pets and children that become frightened, accidents leading to property damage and bodily harm, and so on. Therefore, the market equilibrium quantity of fireworks does not equal the socially optimal quantity. The following graph plots the demand for fireworks (their private value), the supply of fireworks (the private cost of producing them), and the social cost of fireworks, including both the private cost and external costs. Use the black point (plus symbol) to indicate the market equilibrium quantity. Next, use the purple point (diamond symbol) to indicate the socially optimal quantity. PRICE OF FIREWORKS Social Cost Supply (Private Cost) Demand (Private Value) QUANTITY OF FIREWORKS + Market Equilibrium Socially Optimal Level3°F 2. Efficiency in the presence of externalities Air horns impose many external costs on society: the risk of being deafened, the annoyance of being awakened in the middle of the night, and so on. Therefore, the market equilibrium quantity of air horns is not equal to the socially optimal quantity. The following graph shows the demand for air horns (their private value), the supply of air horns (the private cost of producing them), and the social cost of air horns, including both the private cost and external costs. Use the black point (plus symbol) to indicate the market equilibrium quantity. Next, use the purple point (diamond symbol) to indicate the socially optimal quantity. Social Cost Market Equilibrium Socially Optimal Level oudy PRICE OF AIR HORNS Supply (Private Cost) D3. The total (abatement) cost for cutting down on CO2 by R is C(R) = 7R²+10R. The total benefit of CO2 abatement to the society is B = 100R.. Compute the socially optimal level of abatement (pollution control).
- 2. Efficiency in the presence of externalities Public wifi hotspots grant many external benefits on society: more equitable access to the Internet, increased educational opportunities, and so on. Therefore, the market equilibrium quantity of public wifi hotspots does not equal the socially optimal quantity. The following graph plots the demand for public win hotspots (their private value), the supply of public with hotspots (the private cost of producing them), and the social value of public wif hotspots, including both the private value and external benefits. Use the black point (plus symbol) to indicate the market equilibrium quantity. Next, use the purple point (diamond symbol) to indicate the socially optimal quantity. PRICE OF PUBLIC WIFI HOTSPOTS Supply (Private Cost) Social Value Demand (Private Value) QUANTITY OF PUBLIC WIFI HOTSPOTS + Market Equilibrum . Socially Optimal Level3. The effect of negative externalities on the optimal quantityof consumption Consider the market for electric cars. Suppose that a electric car manufacturing facility dumps sludge into a nearby river, creating a negative externality for those living downstream from the facility. Producing additional electric cars imposes a constant per-unit external cost of $210. The following graph shows the demand (private value) curve and the supply (private cost) curve for electric cars. Use the purple points (diamond symbol) to plot the social cost curve when the external cost is $210 per unit. PRICE (Dollars per unit of electric cars) 1400 1260 1120 980 840 700 560 420 280 140 0 0 O U 1 U O O 2 3 4 5 QUANTITY (Units of electric cars) The market equilibrium quantity is 6 Supply (Private Cost) Demand (Private Value) 7 Social Cost ? units of electric cars, but the socially optimal quantity of electric car production is To create an incentive for the firm to produce the socially optimal quantity of…3. The effect of negative externalities on the optimal quantityof consumption Consider the market for electric cars. Suppose that a electric car manufacturing facility dumps sludge into a nearby river, creating a negative externality for those living downstream from the facility. Producing additional electric cars imposes a constant per-unit external cost of $160. The following graph shows the demand (private value) curve and the supply (private cost) curve for electric cars. Use the purple points (diamond symbol) to plot the social cost curve when the external cost is $160 per unit. ? PRICE (Dollars per unit of electric cars) 800 720 640 560 480 400 320 240 160 80 0 0 O ☐ 1 ☐ O ☐ O ☐ ☐ O 2 3 5 QUANTITY (Units of electric cars) ☐ Supply (Private Cost) O Demand (Private Value) 6 7 Social Cost 1.5 To create an incentive for the firm to produce the socially optimal quantity of electric cars, the government could impose a per unit of electric cars. 2 2.5 3 3.5 4 4.5 5 5.5 The market…
- 5) Mr. Leon is at it again! He vandalized a public park. Now society has to clean it up. Based on the numbers below what would be the socially optimal amount that should be cleaned up? % cleaned total benefits total costs 25 $10,000 $1,000 50 $15,000 $4,000 75 $18,000 $7,000 100 $19,000 $10,000 *Show the marginal benefits and marginal costs, graphically.3. The effect of negative externalities on the optimal quantity of consumption Consider the market for electric cars. Suppose that a electric car manufacturing facility dumps sludge into a nearby river, creating a negative externality for those living downstream from the facility. Producing additional electric cars imposes a constant per-unit external cost of $210. The following graph shows the demand (private value) curve and the supply (private cost) curve for electric cars. Use the purple points (diamond symbol) to plot the social cost curve when the external cost is $210 per unit3. Suppose the EPA wants to reduce pollution to the socially optimal level. Based on the data in the table below, what is the optimal level of pollution? Total cleanup Total Total (tons) Benefit Cost 50 2 85 18 3 115 28 4 140 39 5 160 51 179 63 7 197 76 8 214 90 230 105 10 245 120 11 259 137 12 273 156 13 286 177 14 299 200 15 311 225