
MATLAB: An Introduction with Applications
6th Edition
ISBN: 9781119256830
Author: Amos Gilat
Publisher: John Wiley & Sons Inc
expand_more
expand_more
format_list_bulleted
Related questions
infoPractice Pack
Question
infoPractice Pack
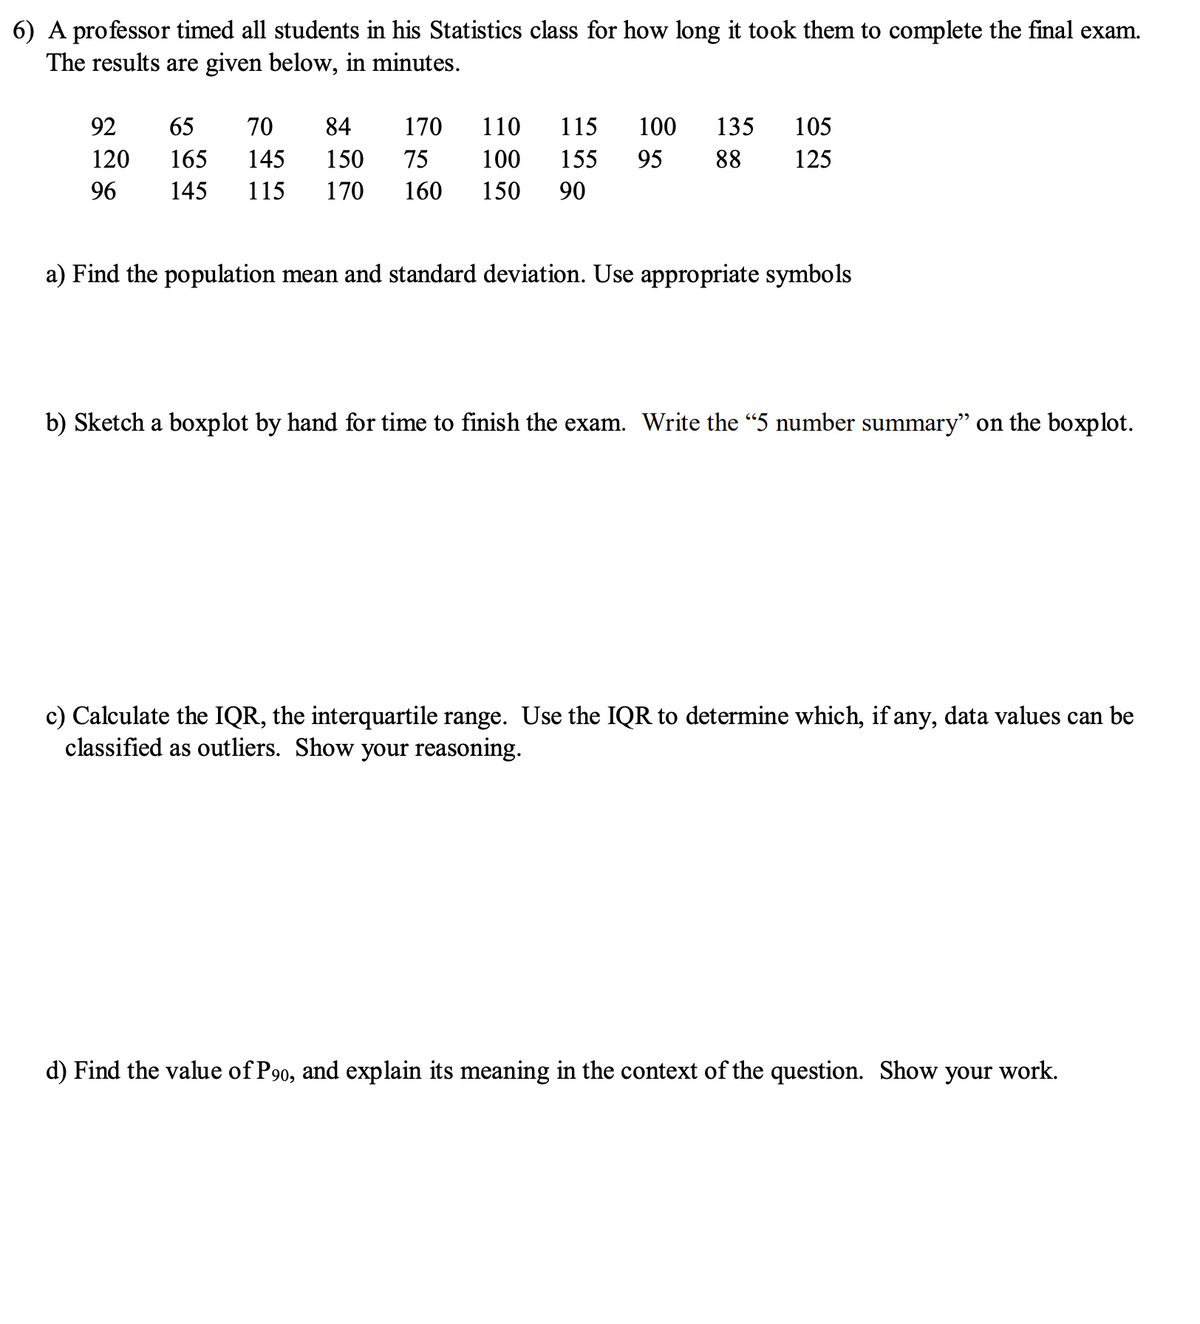

Transcribed Image Text:6) A professor timed all students in his Statistics class for how long it took them to complete the final exam.
The results are given below, in minutes.
92
170
65 70 84
145 150
145 115 170 160 150 90
110 115 100 135 105
100 155 95 88 125
120
165
75
96
a) Find the population mean and standard deviation. Use appropriate symbols
b) Sketch a boxplot by hand for time to finish the exam. Write the "5 number summary" on the boxplot.
c) Calculate the IQR, the interquartile range. Use the IQR to determine which, if any, data values can be
classified as outliers. Show your reasoning.
d) Find the value of P90, and explain its meaning in the context of the question. Show
your work.

Transcribed Image Text:7) Use Google Sheets or another app/program to create a histogram that displays the times from #6. Use an
interval "bucket" width of 20 and start your first interval at 64.5. Copy and paste the chart into a document
to upload as part of your problem set.
8) The following gives the national percentages of adults in a given age group. Use Google Sheets or another
app/program to create a pie chart that clearly displays this data to an audience. Copy and paste the chart into
a document to upload as part of your problem set.
Age Group
Percentage
18 - 29
17
30 - 44 45 - 59 60 or older
27
25
31
Expert Solution
This question has been solved!
Explore an expertly crafted, step-by-step solution for a thorough understanding of key concepts.

This is a popular solution

Includes step-by-step video

Trending nowThis is a popular solution!

Learn your wayIncludes step-by-step video

Step by stepSolved in 2 steps with 1 images

Knowledge Booster

Similar questions
- Make frequency tables for the following data sets. Include columns for relative and cumulative frequency. Also, make a bar graph for the frequency. A website that reviews recent movies lists 5 five-star films (the highest rating), 15 four-star films, 15 three-star films, 10 two-star films, and 5 one-star films.arrow_forward(Please do not give solution in image format thanku)arrow_forwardolympic.instructure.com The boxplots below represent movie run-times (length of a movie in minutes) for movies that have been rated by the Motion Picture Associate of America as R, PG-13, PG, and G. List ratings according to their median run-times from shortest to longest. PG-13 PG 80 100 120 140 160 180 - Runtime (in minutes) G, PG, PG-13, R G, PG, R, PG-13 R, PG-13, G, PG 8.arrow_forward
- Helparrow_forwardThe following chart provides data that is widespread. Use this data to answer questions 11 through 14. Ages: 25 41 33 42 28 31 35 41 22 0. 27 23 34 40 38 38 28 25arrow_forwardUse the same scales to construct modified boxplots for the pulse rates of men and women from the accompanying data sets. Identify any outliers. Use the boxplots to compare the two data sets. Click the icon to view the data sets. Determine the boxplot for the men's pulse rate data. Choose the correct graph below. A. O C. XX ידידי T 40 50 60 70 80 90 100110 יויד 40 50 60 70 80 90 100110 ... ✔ B. D. רידי 40 50 60 70 80 90 100110 X T 40 50 60 70 80 90 100110 יוידarrow_forward
- Find the five-number summary for the following data set. 55, 60, 63, 74, 88, 96, 98, 106, 107, 110arrow_forwardSolve c through harrow_forwardGiven the following list of data, find the median. 3,18,11,36,23,5,8,15,32,22,16 Give your answer as a number only. For example, if you found the median was 20, you would enter 20.arrow_forward
arrow_back_ios
SEE MORE QUESTIONS
arrow_forward_ios
Recommended textbooks for you
- MATLAB: An Introduction with ApplicationsStatisticsISBN:9781119256830Author:Amos GilatPublisher:John Wiley & Sons Inc
 Probability and Statistics for Engineering and th...StatisticsISBN:9781305251809Author:Jay L. DevorePublisher:Cengage Learning
 Statistics for The Behavioral Sciences (MindTap C...StatisticsISBN:9781305504912Author:Frederick J Gravetter, Larry B. WallnauPublisher:Cengage Learning
  Elementary Statistics: Picturing the World (7th E...StatisticsISBN:9780134683416Author:Ron Larson, Betsy FarberPublisher:PEARSON
 The Basic Practice of StatisticsStatisticsISBN:9781319042578Author:David S. Moore, William I. Notz, Michael A. FlignerPublisher:W. H. Freeman
 Introduction to the Practice of StatisticsStatisticsISBN:9781319013387Author:David S. Moore, George P. McCabe, Bruce A. CraigPublisher:W. H. Freeman
MATLAB: An Introduction with Applications
Statistics
ISBN:9781119256830
Author:Amos Gilat
Publisher:John Wiley & Sons Inc
Probability and Statistics for Engineering and th...
Statistics
ISBN:9781305251809
Author:Jay L. Devore
Publisher:Cengage Learning
Statistics for The Behavioral Sciences (MindTap C...
Statistics
ISBN:9781305504912
Author:Frederick J Gravetter, Larry B. Wallnau
Publisher:Cengage Learning
Elementary Statistics: Picturing the World (7th E...
Statistics
ISBN:9780134683416
Author:Ron Larson, Betsy Farber
Publisher:PEARSON
The Basic Practice of Statistics
Statistics
ISBN:9781319042578
Author:David S. Moore, William I. Notz, Michael A. Fligner
Publisher:W. H. Freeman
Introduction to the Practice of Statistics
Statistics
ISBN:9781319013387
Author:David S. Moore, George P. McCabe, Bruce A. Craig
Publisher:W. H. Freeman