MATLAB: An Introduction with Applications
6th Edition
ISBN: 9781119256830
Author: Amos Gilat
Publisher: John Wiley & Sons Inc
expand_more
expand_more
format_list_bulleted
Question

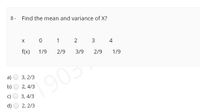
Transcribed Image Text:8- Find the mean and variance of X?
X
1
2 3
4
f(x)
1/9
2/9
3/9
2/9
1/9
a)
3, 2/3
1903
b)
2, 4/3
c)
3, 4/3
d)
2, 2/3
Expert Solution
This question has been solved!
Explore an expertly crafted, step-by-step solution for a thorough understanding of key concepts.
This is a popular solution
Trending nowThis is a popular solution!
Step by stepSolved in 3 steps

Knowledge Booster
Learn more about
Need a deep-dive on the concept behind this application? Look no further. Learn more about this topic, statistics and related others by exploring similar questions and additional content below.Similar questions
- .arrow_forwardParagraph Styles 4. Compute the average deviation on the data below Test scores X-X bar IX1 Xi 57 60 65 70 78 s0 82 85 93 |x| Average deviationarrow_forward117. The coefficient of correlation when coefficients of regression and 1.8 is (a) 0.36 (b) 0.2 (c) 0.6 (d) 0.9 are 0.2arrow_forward
- An analysis of variance produces SSbetween = 40, SSwithin = 60, and an F-ratio with df = 2, 15. For this analysis, what is the F-ratio?arrow_forwardAn analysis of variance produces SSetween 30, SSwithin " 60, and an F-ratio with df 2, 15. For this analysis, what is the F-ratio? O 2.00 O 0.50 O 3.75 O 0.27arrow_forwardT/F question the MSE(theta) for an unbiased estimator is given by its variance.arrow_forward
- 2 Please helparrow_forwardA population of N = 5 scores has a mean of µ = 8. If one score with a value of X = 4 is removed from the population, what is the value for the new mean? What is the mode for the population of scores shown in the frequency distribution table? X f 5 3 4 4 3 3 2 3 1 2 After every score in a sample of n = 5 is multiplied by 2, the mean is calculated and found to be M = 8. What was the mean of the original sample?arrow_forwardWhat is indicated by a Pearson correlation of r= +1.00 between X and Y? O Every increase in X causes an increase in Y Every change in X causes a change in Y O Each time X increases, there is a perfectly predictable increase in Y All of the other 3 choices occur with a correlation of +1.00.arrow_forward
- suppose the mean is 8 and 1/3 and the population variance is 6 and 8/9 and a>9 x 5 9 a frequency 3 f 2 a=? f=?arrow_forward3. Let X Pois(4). Find the distribution of Y = √X.arrow_forwardAre the signs of the coefficients on the variables "Frequency of Flights" and "Destination is a Big City" corresponding to the utility of the "Air" mode meaningful? Utility for Car Utility for Air param. t stat Param. t stat Constant 4.77 6.995 0 fixed Travel Time (mins) -0.03 -16.926 -0.03 -16.926 Travel Cost / Income ($/$) -726.35 -4.28 -726.35 -4.28 Frequency of Flights (per week) 0 fixed 0.12 13.414 Is Destination a Large City 0 fixed 1.5 5.576 Travel Party Size > =2^2 1.75 5.873 0 Fixedarrow_forward
arrow_back_ios
arrow_forward_ios
Recommended textbooks for you
 MATLAB: An Introduction with ApplicationsStatisticsISBN:9781119256830Author:Amos GilatPublisher:John Wiley & Sons Inc
 Probability and Statistics for Engineering and th...StatisticsISBN:9781305251809Author:Jay L. DevorePublisher:Cengage Learning
 Statistics for The Behavioral Sciences (MindTap C...StatisticsISBN:9781305504912Author:Frederick J Gravetter, Larry B. WallnauPublisher:Cengage Learning
 Elementary Statistics: Picturing the World (7th E...StatisticsISBN:9780134683416Author:Ron Larson, Betsy FarberPublisher:PEARSON
 The Basic Practice of StatisticsStatisticsISBN:9781319042578Author:David S. Moore, William I. Notz, Michael A. FlignerPublisher:W. H. Freeman
 Introduction to the Practice of StatisticsStatisticsISBN:9781319013387Author:David S. Moore, George P. McCabe, Bruce A. CraigPublisher:W. H. Freeman

MATLAB: An Introduction with Applications
Statistics
ISBN:9781119256830
Author:Amos Gilat
Publisher:John Wiley & Sons Inc

Probability and Statistics for Engineering and th...
Statistics
ISBN:9781305251809
Author:Jay L. Devore
Publisher:Cengage Learning

Statistics for The Behavioral Sciences (MindTap C...
Statistics
ISBN:9781305504912
Author:Frederick J Gravetter, Larry B. Wallnau
Publisher:Cengage Learning

Elementary Statistics: Picturing the World (7th E...
Statistics
ISBN:9780134683416
Author:Ron Larson, Betsy Farber
Publisher:PEARSON

The Basic Practice of Statistics
Statistics
ISBN:9781319042578
Author:David S. Moore, William I. Notz, Michael A. Fligner
Publisher:W. H. Freeman

Introduction to the Practice of Statistics
Statistics
ISBN:9781319013387
Author:David S. Moore, George P. McCabe, Bruce A. Craig
Publisher:W. H. Freeman