MATLAB: An Introduction with Applications
6th Edition
ISBN: 9781119256830
Author: Amos Gilat
Publisher: John Wiley & Sons Inc
expand_more
expand_more
format_list_bulleted
Question

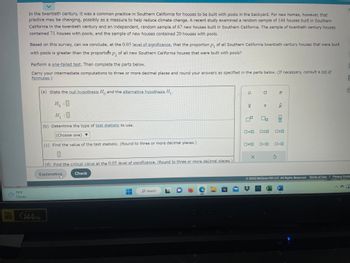
Transcribed Image Text:### Analyzing the Prevalence of Pools in Southern California Homes
In the twentieth century, it was common in Southern California for homes to be built with pools in the backyard. Recently, there has been a change due to potential climate impact reduction efforts. A study examined a random sample of 144 houses built in the twentieth century and a sample of 67 recent new houses in Southern California. The twentieth-century sample had 71 houses with pools, while the new sample had 20 houses with pools.
**Objective:** Determine if the proportion \( p_1 \) of all Southern California twentieth-century houses with pools is greater than the proportion \( p_2 \) of all new Southern California houses with pools using a one-tailed test at a 0.05 level of significance.
#### Steps for Analysis
1. **Hypotheses Setup**
- **Null Hypothesis** \( H_0 \): The proportion of houses with pools in the twentieth-century sample is equal to or less than in the new house sample.
- **Alternative Hypothesis** \( H_1 \): The proportion of twentieth-century houses with pools is greater than the new house sample.
2. **Type of Test Statistic**
- Choose the appropriate test statistic, likely a Z-test due to proportions being involved.
3. **Calculate the Test Statistic**
- Perform calculations to determine the test statistic value. Round to three or more decimal places.
4. **Determine the Critical Value**
- Identify the critical value at a 0.05 level of significance, rounding to three or more decimal places.
5. **Table and Symbols**
- The table shown in the image allows selection and insertion of statistical symbols necessary for hypothesis statements and calculations.
6. **Conclusion**
- Based on the comparison of the test statistic to the critical value, conclude whether to reject or fail to reject the null hypothesis.
**Note:** For detailed calculations, intermediate computations should be carried to three or more decimal places. Consult relevant statistical formulas as necessary.
---
**Resources:** For additional assistance, refer to statistical texts or online resources that discuss hypothesis testing, specifically concerning proportions.

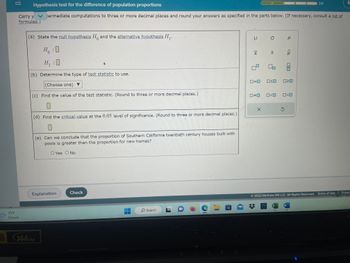
Transcribed Image Text:The image is a section of a webpage titled "Hypothesis test for the difference of population proportions". It guides users through a hypothesis test, prompting them to input their answers in the form provided. Let's go through each step in detail:
### Sections:
1. **Hypothesis Statements**:
- **Null Hypothesis (\(H_0\))**: Enter your statement here about the populations being equal.
- **Alternative Hypothesis (\(H_1\))**: Enter the hypothesis statement about the populations not being equal.
2. **Test Statistic**:
- **Determine the Type**: Use the dropdown menu to choose the appropriate test statistic for the hypothesis test.
3. **Value of the Test Statistic**:
- **Calculation Field**: Input the calculated test statistic value. Users are instructed to round to three or more decimal places.
4. **Critical Value**:
- **Significance Level**: Find and enter the critical value corresponding to a 0.05 level of significance.
5. **Conclusion**:
- **Comparison of Proportions**: Answer whether the proportion of Southern California twentieth-century houses with pools is greater than the proportion for new homes. Options provided are 'Yes' or 'No'.
### Tools Displayed:
- **Symbols and Operators**: There are various mathematical symbols provided on the right side for easy input, including:
- Greek letters (e.g., \(\mu, \sigma, \rho\))
- Mathematical operators and symbols like standard deviation \(s\) and proportions \(\hat{p}\).
This section is part of an interactive online educational platform (© 2022 McGraw Hill LLC) where users can test their understanding of statistical tests with step-by-step input fields and explanations.
Expert Solution
This question has been solved!
Explore an expertly crafted, step-by-step solution for a thorough understanding of key concepts.
This is a popular solution
Trending nowThis is a popular solution!
Step by stepSolved in 5 steps with 20 images

Knowledge Booster
Similar questions
- Students in a representative sample of 69 second-year students selected from a large university in England participated in a study of academic procrastination. Each student in the sample completed the Tuckman Procrastination Scale, which measures procrastination tendencies. Scores on this scale can range from 16 to 64, with scores over 40 indicating higher levels of procrastination. For the 69 second-year students in the study at the university, the sample mean procrastination score was 41.00 and the sample standard deviation was 6.83. n USE SALT (a) Construct a 95% confidence interval estimate of u, the population mean procrastination scale for second-year students at this college. (Use technology to calculate the critical value. Round your answers to three decimal places.) (b) How does the confidence interval for the population mean score for second-year students compare to the confidence interval for first-year students of (35.422, 38.618)? What does this tell you about the…arrow_forwardAn industrial-organizational psychologist is interested in discovering the relationship between the tempo of preferred music that is played in a workplace and employee mood. Employees chose their favorite song on an MP3 player and then reported their moods when listening to that piece of music. A total of 10 participants were asked individually and brought in their own MP3 players; the least number of songs on an employee's MP3 player was 350. The sample data are presented as a scatterplot below. The psychologist wants to use a Pearson correlation coefficient to analyze the relationship. Considering the assumptions for this statistic, which of these statements is the correct course of action? A. The researcher has chosen the wrong statistic to represent this relationship. B. The researcher has violated a robust assumption and should be able to calculate r. C. The researcher has chosen the right statistic because all the assumptions are valid. D. The researcher has violated a…arrow_forwardA contributor for the local newspaper is writing an article for the weekly fitness section. To prepare for the story, she conducts a study to compare the exercise habits of people who exercise in the morning to the exercise habits of people who work out in the afternoon or evening. She selects three different health centers from which to draw her samples. The 56 people she sampled who work out in the morning have a mean of 4.4 hours of exercise each week. The 63 people surveyed who exercise in the afternoon or evening have a mean of 4.2 hours of exercise each week. Assume that the weekly exercise times have a population standard deviation of 0.8 hours for people who exercise in the morning and 0.7 hours for people who exercise in the afternoon or evening. Let Population 1 be people who exercise in the morning and Population 2 be people who exercise in the afternoon or evening. Step 1 of 2: Construct a 99% confidence interval for the true difference between the mean amounts of…arrow_forward
Recommended textbooks for you
 MATLAB: An Introduction with ApplicationsStatisticsISBN:9781119256830Author:Amos GilatPublisher:John Wiley & Sons Inc
 Probability and Statistics for Engineering and th...StatisticsISBN:9781305251809Author:Jay L. DevorePublisher:Cengage Learning
 Statistics for The Behavioral Sciences (MindTap C...StatisticsISBN:9781305504912Author:Frederick J Gravetter, Larry B. WallnauPublisher:Cengage Learning
 Elementary Statistics: Picturing the World (7th E...StatisticsISBN:9780134683416Author:Ron Larson, Betsy FarberPublisher:PEARSON
 The Basic Practice of StatisticsStatisticsISBN:9781319042578Author:David S. Moore, William I. Notz, Michael A. FlignerPublisher:W. H. Freeman
 Introduction to the Practice of StatisticsStatisticsISBN:9781319013387Author:David S. Moore, George P. McCabe, Bruce A. CraigPublisher:W. H. Freeman

MATLAB: An Introduction with Applications
Statistics
ISBN:9781119256830
Author:Amos Gilat
Publisher:John Wiley & Sons Inc

Probability and Statistics for Engineering and th...
Statistics
ISBN:9781305251809
Author:Jay L. Devore
Publisher:Cengage Learning

Statistics for The Behavioral Sciences (MindTap C...
Statistics
ISBN:9781305504912
Author:Frederick J Gravetter, Larry B. Wallnau
Publisher:Cengage Learning

Elementary Statistics: Picturing the World (7th E...
Statistics
ISBN:9780134683416
Author:Ron Larson, Betsy Farber
Publisher:PEARSON

The Basic Practice of Statistics
Statistics
ISBN:9781319042578
Author:David S. Moore, William I. Notz, Michael A. Fligner
Publisher:W. H. Freeman

Introduction to the Practice of Statistics
Statistics
ISBN:9781319013387
Author:David S. Moore, George P. McCabe, Bruce A. Craig
Publisher:W. H. Freeman