Trigonometry (11th Edition)
11th Edition
ISBN: 9780134217437
Author: Margaret L. Lial, John Hornsby, David I. Schneider, Callie Daniels
Publisher: PEARSON
expand_more
expand_more
format_list_bulleted
Concept explainers
Question
find the focus and directrix of each parabola and graph the parabola.
![**Equation of the Parabola:**
\[ (x + 1)^2 = -8(y + 1) \]
**Vertex:**
The vertex of the parabola is \((-1, -1)\).
**Focus:**
The focus of the parabola is \((-1, -3)\).
**Directrix:**
The directrix of the parabola is the line \(y = 1\).
**Two Points:**
Two points on the parabola are \((-3, -2)\) and \((1, -2)\).
**Graph Description:**
The graph displays a coordinate plane with a grid. The x-axis and y-axis intersect at the origin \((0,0)\), with markings for both positive and negative values. The parabola opens downward, with its vertex at \((-1, -1)\). The points \((-3, -2)\) and \((1, -2)\) lie on the parabola, and the axis of symmetry is vertical, passing through the vertex.](https://content.bartleby.com/qna-images/question/da14e668-9ddd-4e75-9b43-53334816616b/5b0d38c6-bbec-4625-9bad-860b9f4fa6db/ljvmk6c_thumbnail.jpeg)
Transcribed Image Text:**Equation of the Parabola:**
\[ (x + 1)^2 = -8(y + 1) \]
**Vertex:**
The vertex of the parabola is \((-1, -1)\).
**Focus:**
The focus of the parabola is \((-1, -3)\).
**Directrix:**
The directrix of the parabola is the line \(y = 1\).
**Two Points:**
Two points on the parabola are \((-3, -2)\) and \((1, -2)\).
**Graph Description:**
The graph displays a coordinate plane with a grid. The x-axis and y-axis intersect at the origin \((0,0)\), with markings for both positive and negative values. The parabola opens downward, with its vertex at \((-1, -1)\). The points \((-3, -2)\) and \((1, -2)\) lie on the parabola, and the axis of symmetry is vertical, passing through the vertex.

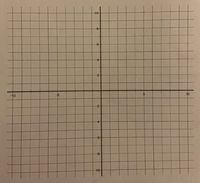
Transcribed Image Text:The image shows a Cartesian coordinate system graph with both x-axis and y-axis ranging from -10 to 10. The grid is made up of squares, each representing one unit. The x-axis is the horizontal line and the y-axis is the vertical line, intersecting at the origin (0, 0). Numbers are marked at intervals of one along both axes. This type of graph is often used to plot points, lines, and curves in mathematics and can be used in various subjects such as algebra and geometry. The thick lines at integers help in easily identifying and plotting coordinates.
Expert Solution
This question has been solved!
Explore an expertly crafted, step-by-step solution for a thorough understanding of key concepts.
This is a popular solution
Trending nowThis is a popular solution!
Step by stepSolved in 3 steps with 1 images

Knowledge Booster
Learn more about
Need a deep-dive on the concept behind this application? Look no further. Learn more about this topic, trigonometry and related others by exploring similar questions and additional content below.Similar questions
Recommended textbooks for you
 Trigonometry (11th Edition)TrigonometryISBN:9780134217437Author:Margaret L. Lial, John Hornsby, David I. Schneider, Callie DanielsPublisher:PEARSON
 Trigonometry (MindTap Course List)TrigonometryISBN:9781305652224Author:Charles P. McKeague, Mark D. TurnerPublisher:Cengage Learning
 Trigonometry (MindTap Course List)TrigonometryISBN:9781337278461Author:Ron LarsonPublisher:Cengage Learning

Trigonometry (11th Edition)
Trigonometry
ISBN:9780134217437
Author:Margaret L. Lial, John Hornsby, David I. Schneider, Callie Daniels
Publisher:PEARSON

Trigonometry (MindTap Course List)
Trigonometry
ISBN:9781305652224
Author:Charles P. McKeague, Mark D. Turner
Publisher:Cengage Learning


Trigonometry (MindTap Course List)
Trigonometry
ISBN:9781337278461
Author:Ron Larson
Publisher:Cengage Learning