
A First Course in Probability (10th Edition)
10th Edition
ISBN: 9780134753119
Author: Sheldon Ross
Publisher: PEARSON
expand_more
expand_more
format_list_bulleted
Related questions
Question
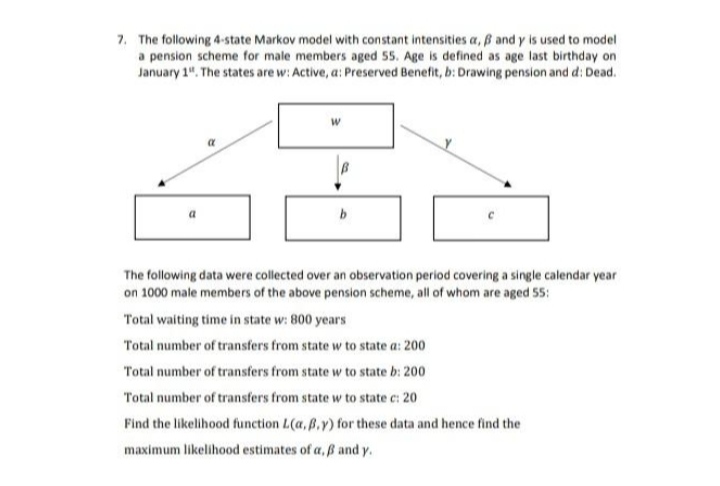

Transcribed Image Text:7. The following 4-state Markov model with constant intensities a, B and y is used to model
a pension scheme for male members aged 55. Age is defined as age last birthday on
January 1". The states are w: Active, a: Preserved Benefit, b: Drawing pension and d: Dead.
The following data were collected over an observation period covering a single calendar year
on 1000 male members of the above pension scheme, all of whom are aged 55:
Total waiting time in state w: 800 years
Total number of transfers from state w to state a: 200
Total number of transfers from state w to state b: 200
Total number of transfers from state w to state c: 20
Find the likelihood function L(a, B.y) for these data and hence find the
maximum likelihood estimates of a,ß and y.
Expert Solution
This question has been solved!
Explore an expertly crafted, step-by-step solution for a thorough understanding of key concepts.

Step by stepSolved in 2 steps

Knowledge Booster

Similar questions
- StarHortons Cup, the coffee company, wants to determine how long caffeine lasts throughout the day when individuals have a cup of one of their 3 types of coffee at 9am. They will then measure the levels of caffeine in these individuals’ systems at 10am, 12am, 2pm, 4pm, 6pm and 8pm. They want to have at least 20 observations per group. How many separate/distinct groups of participants are needed if they want to conduct this experiment using a mixed-measures ANOVA? 18 6 20 3arrow_forwardSuppose you are a production manager for a small firm that manufactures designer phone cases. Your production facility utilizes three machines. Quality is binary — each phone case is either defective or it is not defective. Each hour, Machines 1, 2, and 3 produce 10, 10 and 20 phone cases, respectively. But because the machines differ slightly in their technology, data on past production has shown that they differ in terms of their rates of defective output — specifically, Machines 1, 2, and 3 have rates of defective production of 2%, 4%, and 5%, respectively. If one phone case is selected randomly from one hour’s total output, and that phone case is found to be defective, what is the probability that it was produced by Machine 1? Machine 2? Machine 3?arrow_forward1. A hospital keeps a record of the number of males and females in different age groups who contract a particular disease. The data are summarized as follows: Age Groups: 10-25 26-40 41-55 56 + Male: 23, 34, 20, 64 Female: 31, 29, 55, 44 a) Are gender and age of contracting the disease independent of one another (a < .05)? b) A researcher believes that people in the 41-55 age group are three times as likely to develop the disease as are those in each of the two younger age groups, while those in the 56 + age group are only twice as likely (relative to those in the two youngest groups). The two youngest age groups are not expected to differ from each other. Do the data support these beliefs (a < .01)? c) It is also believed that, relative to males, the proportion of females in the 56 + age group that develops the disease is significantly different from the proportion of females in the 10-25 age group that develops the disease. Test this belief with a 5.05. Answers 1. a) x2 =…arrow_forward
- he National Football League (NFL) holds its annual draft of the nation's best college football players in April each year. Prior to the draft, various sporting news services project the players who will be drafted along with the order in which each will be selected in what are called mock drafts. Players who are considered to have superior potential as professional football players are selected earlier in the draft. Suppose the following table shows projections by one mock draft service of what position in the first round players from the Atlantic Coast Conference, the Big Ten Conference, the PAC-12 Conference, and the Southeastern Conference will be selected. ACC Big Ten PAC-12 SEC CollegeAttended ProjectedDraftPosition CollegeAttended ProjectedDraftPosition CollegeAttended ProjectedDraftPosition CollegeAttended ProjectedDraftPosition Florida State 4 Iowa 9 USC 1 Florida 2 Clemson 5 Michigan St 10 Oregon 6 Alabama 3 Miami 7 Nebraska 14 Oregon 15 Kentucky 8 Georgia Tech 13…arrow_forwardThe National Football League (NFL) holds its annual draft of the nation's best college football players in April each year. Prior to the draft, various sporting news services project the players who will be drafted along with the order in which each will be selected in what are called mock drafts. Players who are considered to have superior potential as professional football players are selected earlier in the draft. Suppose the following table shows projections by one mock draft service of what position in the first round players from the Atlantic Coast Conference, the Big Ten Conference, the PAC-12 Conference, and the Southeastern Conference will be selected. ACC Big Ten PAC-12 SEC CollegeAttended ProjectedDraftPosition CollegeAttended ProjectedDraftPosition CollegeAttended ProjectedDraftPosition CollegeAttended ProjectedDraftPosition Florida State 4 Iowa 7 USC 2 Florida 1 Clemson 5 Michigan St 10 Oregon 9 Alabama 3 Miami 6 Nebraska 12 Oregon 15 Kentucky 8 Georgia Tech…arrow_forwardScenario 3. A researcher creates a new program for college students to reduce feelings of loneliness and enhance students' engagement on campus. This new program helps students to find student groups and clubs that fit their interests. She randomly assigns students to either enroll in this new program (the experimental group) or to not enroll in the program (the control group). She compares students' feelings of engagement between the two groups, and expects that engagement will be higher among the students that are in the program. What is the most appropriate test statistic to use to test the hypothesis in scenario 3? A) z-test B) z-score C) Independent samples t-Test D) Correlation Coefficient E) One-way ANOVA F) Dependent samples t-Test G) Factor Analysis H) Structural Equation Model What is the null hypothesis for scenario 3? A) H0: engagement in the experimental group ≤ engagement in the control group B) H0 : engagement in the experimental group = engagement in the control…arrow_forward
arrow_back_ios
arrow_forward_ios
Recommended textbooks for you
- A First Course in Probability (10th Edition)ProbabilityISBN:9780134753119Author:Sheldon RossPublisher:PEARSON

A First Course in Probability (10th Edition)
Probability
ISBN:9780134753119
Author:Sheldon Ross
Publisher:PEARSON