MATLAB: An Introduction with Applications
6th Edition
ISBN: 9781119256830
Author: Amos Gilat
Publisher: John Wiley & Sons Inc
expand_more
expand_more
format_list_bulleted
Question
#67

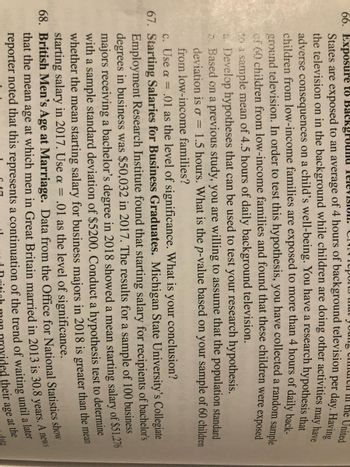
Transcribed Image Text:**Educational Content: Statistical Analysis of Economic and Social Data**
**66. Exposure to Background Television:**
The psychological impact of background television on children is an area of investigation. One study suggests that children from low-income families in the United States are exposed to an average of 6 hours of television daily, which can adversely affect their well-being. To test this hypothesis, a study collected a random sample of 60 children from low-income families, finding a sample mean of 4.5 hours of daily TV exposure.
To further analyze:
- Develop your hypotheses to use with your research.
- Based on previous studies, assume the population standard deviation is σ = 1.5 hours.
- Use α = .01 as the level of significance.
- Calculate the p-value for your data and determine whether you can conclude more than 4 hours of exposure daily for children from low-income families.
**67. Starting Salaries for Business Graduates:**
At Michigan State University’s College of Business, a study indicated that the 2017 starting salary for business bachelor’s degree recipients was $50,032. A sample study in 2018 of 100 graduates showed a mean starting salary of $51,276, with a standard deviation of $5,200.
To analyze this data:
- Conduct a hypothesis test to see if 2018's mean starting salary is greater than in 2017.
- Use α = .01 for the level of significance.
- Formulate your conclusion based on the hypothesis test results.
**68. British Men's Age at Marriage:**
According to data from the Office for National Statistics, the average age at which men in Great Britain married in 2013 was 30.8 years. This statistic may indicate social trends or changes in societal norms regarding marriage age.
This educational content aims to explore methods for conducting statistical tests in real-world scenarios, encouraging deeper understanding of data analysis and hypothesis testing.
Expert Solution
arrow_forward
Step 1
Given claim:
The mean starting salary for business majors in 2018 is greater than the mean starting salary in 2017.
Null Hypothesis:
Alternative Hypothesis:
Step by stepSolved in 2 steps

Knowledge Booster
Similar questions
arrow_back_ios
arrow_forward_ios
Recommended textbooks for you
 MATLAB: An Introduction with ApplicationsStatisticsISBN:9781119256830Author:Amos GilatPublisher:John Wiley & Sons Inc
 Probability and Statistics for Engineering and th...StatisticsISBN:9781305251809Author:Jay L. DevorePublisher:Cengage Learning
 Statistics for The Behavioral Sciences (MindTap C...StatisticsISBN:9781305504912Author:Frederick J Gravetter, Larry B. WallnauPublisher:Cengage Learning
 Elementary Statistics: Picturing the World (7th E...StatisticsISBN:9780134683416Author:Ron Larson, Betsy FarberPublisher:PEARSON
 The Basic Practice of StatisticsStatisticsISBN:9781319042578Author:David S. Moore, William I. Notz, Michael A. FlignerPublisher:W. H. Freeman
 Introduction to the Practice of StatisticsStatisticsISBN:9781319013387Author:David S. Moore, George P. McCabe, Bruce A. CraigPublisher:W. H. Freeman

MATLAB: An Introduction with Applications
Statistics
ISBN:9781119256830
Author:Amos Gilat
Publisher:John Wiley & Sons Inc

Probability and Statistics for Engineering and th...
Statistics
ISBN:9781305251809
Author:Jay L. Devore
Publisher:Cengage Learning

Statistics for The Behavioral Sciences (MindTap C...
Statistics
ISBN:9781305504912
Author:Frederick J Gravetter, Larry B. Wallnau
Publisher:Cengage Learning

Elementary Statistics: Picturing the World (7th E...
Statistics
ISBN:9780134683416
Author:Ron Larson, Betsy Farber
Publisher:PEARSON

The Basic Practice of Statistics
Statistics
ISBN:9781319042578
Author:David S. Moore, William I. Notz, Michael A. Fligner
Publisher:W. H. Freeman

Introduction to the Practice of Statistics
Statistics
ISBN:9781319013387
Author:David S. Moore, George P. McCabe, Bruce A. Craig
Publisher:W. H. Freeman