
MATLAB: An Introduction with Applications
6th Edition
ISBN: 9781119256830
Author: Amos Gilat
Publisher: John Wiley & Sons Inc
expand_more
expand_more
format_list_bulleted
Related questions
Question
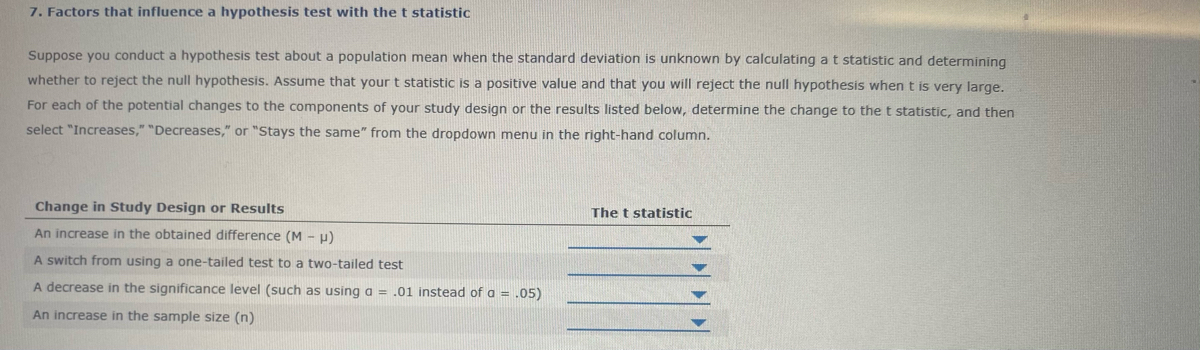

Transcribed Image Text:# Factors that Influence a Hypothesis Test with the T Statistic
When conducting a hypothesis test about a population mean with an unknown standard deviation, the t statistic is used to decide whether to reject the null hypothesis. Assume the t statistic is a positive value and that you will reject the null hypothesis when t is very large.
For each potential change to the components of your study design or the results listed below, determine the change to the t statistic and select "Increases," "Decreases," or "Stays the same" from the dropdown menu in the right-hand column.
### Change in Study Design or Results
1. **An increase in the obtained difference (M - μ)**
2. **A switch from using a one-tailed test to a two-tailed test**
3. **A decrease in the significance level (such as using α = .01 instead of α = .05)**
4. **An increase in the sample size (n)**
Each of these changes can impact the t statistic and, consequently, the outcome of the hypothesis test.
Expert Solution
This question has been solved!
Explore an expertly crafted, step-by-step solution for a thorough understanding of key concepts.

This is a popular solution

Trending nowThis is a popular solution!

Step by stepSolved in 2 steps

Knowledge Booster

Similar questions
- how do you get those answers ? Such as 0.112 and 0.167arrow_forwardSony wants to test the hypothesis that the standard deviation of the ages of Playstation users is greater than the standard deviation of Xbox users. Sample statistics for the two populations are given in the table below. At the α = 0.05 significance level, it is about whether the standard deviation of the ages of the Playstation users is more than the standard deviation of the Xbox users; Sample; PlaystationStandard deviation: 4.3 yearsVolume: 26 XboxStandard deviation: 3.9 yearsVolume: 28 a) Construct the h0 and h1 hypotheses.b) Show the rejection region by scanning on the distribution curve and expressing the critical value.c) Calculate the test statistics.d) Write down and interpret your decision as a result of the hypothesis test.arrow_forwardFind test statistic, critical values & conclusionarrow_forward
- Only test statistic and p value... thank youarrow_forwardCan you help me solve this question. I include the data chart along with itarrow_forwardRecords indicate that the mean weight of mature rainbow trout in Eagle Creek is 2.15 kg with a standard deviation of 0.48 kg. After years of marked oxygen depletion from pollutants in the creek, you want to perform a hypothesis test to see if the standard deviation, ơ, of weights has changed. To do so, you measure the weights of 15 randomly chosen mature rainbow trout from the creek and find that the sample standard deviation is 0.32 kg. Under the assumption that current weights of mature rainbow trout in the creek follow a normal distribution, you will perform a chi-square test. Find x, the value of the test statistic for your chi-square test. Round your answer to three or more decimal places.arrow_forward
- Researchers conducted a study to determine whether magnets are effective in treating back pain. Pain was measured using the visual analog scale, and the results shown below are among the results obtained in the study. Higher scores correspond to greater pain levels. Assume that the two samples are independent simple random samples selected from normally distributed populations, and do not assume that the population standard deviations are equal. Complete parts (a) to (c) below. Reduction in Pain Level After Magnet Treatment (u, ): n=24, x= 0.54, s = 0.96 Reduction in Pain Level After Sham Treatment (H2): n= 24, x= 0.45, s = 1.39 a. Use a 0.01 significance level to test the claim that those treated with magnets have a greater mean reduction in pain than those given a sham treatment (similar to a placebo). What are the null and alternative hypotheses? VA. Ho: H1 = H2 H1: H1 > H2 O B. Ho: H1 # µ2 H1: H1arrow_forwardData on the weights (lb) of the contents of cans of diet soda versus the contents of cans of the regular version of the soda is summarized to the right. Assume that the two samples are independent simple random samples selected from normally distributed populations, and do not assume that the population standard deviations are equal. Complete parts (a) and (b) below. Use a 0.05 significance level for both parts. Diet Regular μ μ1 μ2 n 21 21 x 0.78629lb 0.81612lb s 0.00442lb 0.00748lb =< The test statistic, t, is __ (round to two decimal places) The P-value is __ (round to three decimal places) State the conclusion for the test. A. Fail to reject the null hypothesis. There is sufficient evidence to support the claim that the cans of diet soda have mean weights that are lower than the mean weight for the regular soda. B. Reject the null hypothesis. There is sufficient evidence to support the claim that the cans of diet soda have mean weights that are lower than the mean…arrow_forwardCompute test statistic (Independent t-score) Pooled variance S2p: Estimated standard error S(M1-M2) : Computed Independent t statistic: 2. Make a decision about the null hypothesis and state a conclusion. Decision: Are you going to reject the null or fail to reject the null Conclusion: ex. The independent variable did or did not have a significant effect Remember: if you reject, there was significance When people learn a new task, their performance usually improves when they are tested the next day, but only if they get 6 hours sleep (Sticckgold, et al., 2000). The following data demonstrate this phenomenon. The participants learned a visual discrimination task on one day. Half of the participants were allowed to have at least 6 hours of sleep and the other half were kept awake all night. 6 hours sleep No sleep…arrow_forwardData on the weights (lb) of the contents of cans of diet soda versus the contents of cans of the regular version of the soda is summarized to the right. Assume that the two samples are independent simple random samples selected from normally distributed populations, and do not assume that the population standard deviations are equal. Complete parts (a) and (b) below. Use a 0.05 significance level for both parts. Diet Regular μ μ1 μ2 n 34 34 x 0.79146 lb 0.81544 lb s 0.00437 lb 0.00752 lb A. Test the claim that the contents of cans of diet soda have weights with a mean that is less than the mean for the regular soda. What are the null and alternative hypotheses? A. H0: μ1≠μ2 H1: μ1<μ2 B. H0: μ1=μ2 H1: μ1<μ2 C. H0: μ1=μ2 H1: μ1>μ2 D. H0: μ1=μ2 H1: μ1≠ The test statistic, t, is ______.(Round to two decimal places as needed.) B. Construct a confidence interval…arrow_forwardData on the weights (Ib) of the contents of cans of diet soda versus the contents of cans of the regular version of the soda is summarized to the right. Assume that the two samples are independent simple random samples selected from normally distributed populations, and do not assume that the population standard deviations are equal. Complete parts (a) and (b) below. Use a 0.05 significance level for both parts. Diet Regular H2 40 40 0.78244 lb 0.81852 lb 0.00435 lb 0.00752 lb a. Test the claim that the contents of cans of diet soda have weights with a mean that is less than the mean for the regular soda. What are the null and alternative hypotheses? B. Ho: H1 H2 O A. Ho: H1=42 H: P1arrow_forwardLecture(10.3): Identify the test statistic used for the ANOVA procedure and how it is calculated. (a) The test statistic is F and is the ratio of the variation between groups to the variation within groups. (b) The test staistic is Z and is the ratio of the mean within a group to the variation between groups. (c) The test statistic is Z and is calculated by finding the mean Z score between groups.arrow_forwardarrow_back_iosSEE MORE QUESTIONSarrow_forward_iosRecommended textbooks for you
- MATLAB: An Introduction with ApplicationsStatisticsISBN:9781119256830Author:Amos GilatPublisher:John Wiley & Sons Inc
 Probability and Statistics for Engineering and th...StatisticsISBN:9781305251809Author:Jay L. DevorePublisher:Cengage Learning
 Statistics for The Behavioral Sciences (MindTap C...StatisticsISBN:9781305504912Author:Frederick J Gravetter, Larry B. WallnauPublisher:Cengage Learning
  Elementary Statistics: Picturing the World (7th E...StatisticsISBN:9780134683416Author:Ron Larson, Betsy FarberPublisher:PEARSON
 The Basic Practice of StatisticsStatisticsISBN:9781319042578Author:David S. Moore, William I. Notz, Michael A. FlignerPublisher:W. H. Freeman
 Introduction to the Practice of StatisticsStatisticsISBN:9781319013387Author:David S. Moore, George P. McCabe, Bruce A. CraigPublisher:W. H. Freeman
MATLAB: An Introduction with ApplicationsStatisticsISBN:9781119256830Author:Amos GilatPublisher:John Wiley & Sons IncProbability and Statistics for Engineering and th...StatisticsISBN:9781305251809Author:Jay L. DevorePublisher:Cengage LearningStatistics for The Behavioral Sciences (MindTap C...StatisticsISBN:9781305504912Author:Frederick J Gravetter, Larry B. WallnauPublisher:Cengage LearningElementary Statistics: Picturing the World (7th E...StatisticsISBN:9780134683416Author:Ron Larson, Betsy FarberPublisher:PEARSONThe Basic Practice of StatisticsStatisticsISBN:9781319042578Author:David S. Moore, William I. Notz, Michael A. FlignerPublisher:W. H. FreemanIntroduction to the Practice of StatisticsStatisticsISBN:9781319013387Author:David S. Moore, George P. McCabe, Bruce A. CraigPublisher:W. H. Freeman