
A First Course in Probability (10th Edition)
10th Edition
ISBN: 9780134753119
Author: Sheldon Ross
Publisher: PEARSON
expand_more
expand_more
format_list_bulleted
Related questions
Topic Video
Question

Transcribed Image Text:Document
•••
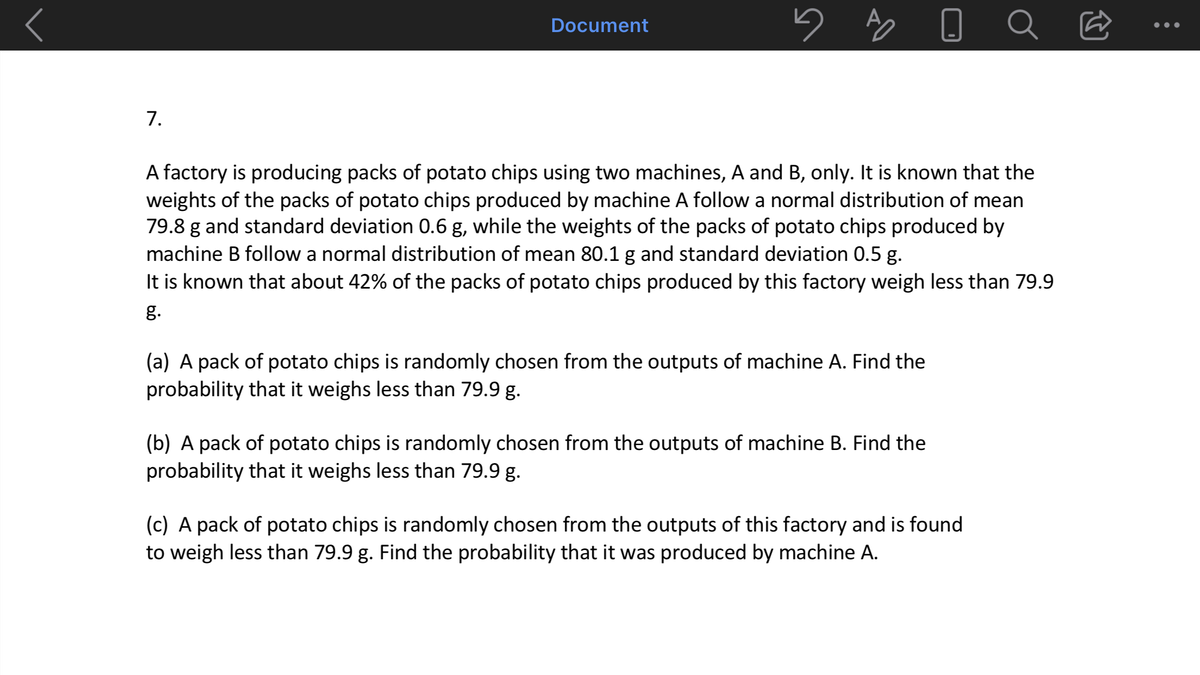
7.
A factory is producing packs of potato chips using two machines, A and B, only. It is known that the
weights of the packs of potato chips produced by machine A follow a normal distribution of mean
79.8 g and standard deviation 0.6 g, while the weights of the packs of potato chips produced by
machine B follow a normal distribution of mean 80.1 g and standard deviation 0.5 g.
It is known that about 42% of the packs of potato chips produced by this factory weigh less than 79.9
g.
(a) A pack of potato chips is randomly chosen from the outputs of machine A. Find the
probability that it weighs less than 79.9 g.
(b) A pack of potato chips is randomly chosen from the outputs of machine B. Find the
probability that it weighs less than 79.9 g.
(c) A pack of potato chips is randomly chosen from the outputs of this factory and is found
to weigh less than 79.9 g. Find the probability that it was produced by machine A.
Expert Solution
This question has been solved!
Explore an expertly crafted, step-by-step solution for a thorough understanding of key concepts.

This is a popular solution

Trending nowThis is a popular solution!

Step by stepSolved in 2 steps with 3 images

Knowledge Booster


Learn more about
Need a deep-dive on the concept behind this application? Look no further. Learn more about this topic, probability and related others by exploring similar questions and additional content below.Similar questions
- Suppose that the average salary of health systems professionals is normally distributed with µ=KES 40,000 and σ = KES 10,000. What proportion of professionals will earn KES 24,800 or less? What proportion of professionals will earn KES 53,500 or more? What proportion of professionals will earn between KES 45,000 and KES 57,000? Calculate the 80th percentile. Calculate the 27th percentilearrow_forward2. Suppose it is claimed that amongst the population of STM1001 students, the number of items bought online in the past year is normally distributed with a mean of u 20 and variance of o2 = 25. Further suppose that we wish to study the mean of the population by taking a random sample of n = 61 STM1001 students. Using this information, write down the distribution of the sample mean, X. Note: In each box, enter a single number rounded to four decimal places where relevant. (2 marks) X~ N( 20 0.4098 2 4. Again following on from the previous question, what is the probability that when we take a random sample of n = 61 STM1001 students, the sample mean would be either greater than 20.3521 or less than 19.6479? [int. orty will b own thatarrow_forwardAssume that the height of male students in a large university is normally distributed with mean 172.7 cm and variance 57.76 cm². (a) Suppose 80 random samples, each with 25 male students are obtained. In how many samples would you expect the sample mean to be between 169.66 cm and 173.46 cm? Give you answer to one decimal place. Answer: number of samples = (b) Suppose 6 random samples, each with 25 male students are obtained. Compute the probability that exactly 4 of the 6 samples will have its sample mean between 169.66 cm and 173.46 cm. Give your answer to two decimal places. Answer: probability=arrow_forward
- 4. Researchers working for a sports drink company would like to know if a new blend if its popular sports drink can help improve marathon runners' final running time. Marathon times, Y, are known to follow a Normal distribution. Suppose that runners using the old blend sports drink have a mean finishing time of 300 minutes (µ = 300 minutes). A random sample of 20 runners was selected to use the new blend of sports drink in a marathon, finishing with an average time of 270 minutes and a standard deviation of 20 minutes (y = 270 min, s = 20 min). Can it be claimed that the new blend lowers finishing times? COr is it possible that random chance alone can explain the discrepancy? Carry out a hypothesis test of the true mean u using the 4- step procedure. Set your alpha-level to 0.05. %3D c. Which test statistic and sampling distribution under the null should we use? O i. z-score; standard Normal O ii. t-statistic; Student'starrow_forward4. Researchers working for a sports drink company would like to know if a new blend if its popular sports drink can help improve marathon runners' final running time. Marathon times, Y, are known to follow a Normal distribution. Suppose that runners using the old blend sports drink have a mean finishing time of 300 minutes (H = 300 minutes). A random sample of 20 runners was selected to use the new blend of sports drink in a marathon, finishing with an average time of 270 minutes and a standard deviation of 20 minutes (y = 270 min, s = 20 min). Can it be claimed that the new blend lowers finishing times? Or is it possible that random chance alone can explain the discrepancy? Carry out a hypothesis test of the true mean u using the 4- step procedure. Set your alpha-level to 0.05. a. Which is the correct null hypothesis? O i. Ho: µ = 300 min O ii: Ho: µ = 270 min %3D O ii. Ho: µ < 300 min iv: Ho: µ < 270 minarrow_forwardSuppose that heights of 10-year-old boys in the US vary according to a normal distribution with mean of 138 cm and standard deviation of 7. Compute the Z-score for a boy with height of 150 cm and find the correct interpretations. a. Boy's height is 0.71 standard deviation lower the national average b. Boy's height is 1.71 standard deviation above the national average c. Boy's height is 1.71 standard deviation lower than the national average d. Boy's height is 2.71 standard deviation above the national averagearrow_forward
arrow_back_ios
arrow_forward_ios
Recommended textbooks for you
- A First Course in Probability (10th Edition)ProbabilityISBN:9780134753119Author:Sheldon RossPublisher:PEARSON

A First Course in Probability (10th Edition)
Probability
ISBN:9780134753119
Author:Sheldon Ross
Publisher:PEARSON