
MATLAB: An Introduction with Applications
6th Edition
ISBN: 9781119256830
Author: Amos Gilat
Publisher: John Wiley & Sons Inc
expand_more
expand_more
format_list_bulleted
Related questions
Concept explainers
Question
thumb_up100%

Transcribed Image Text:5
6 7
8
6 7 8
5
6 7 8
Yards/Attempt
Yards/Attempt
Yards/Attempt
90
80
70
60
50
40
30
20
10
5
7
8
9
Yards/Attempt
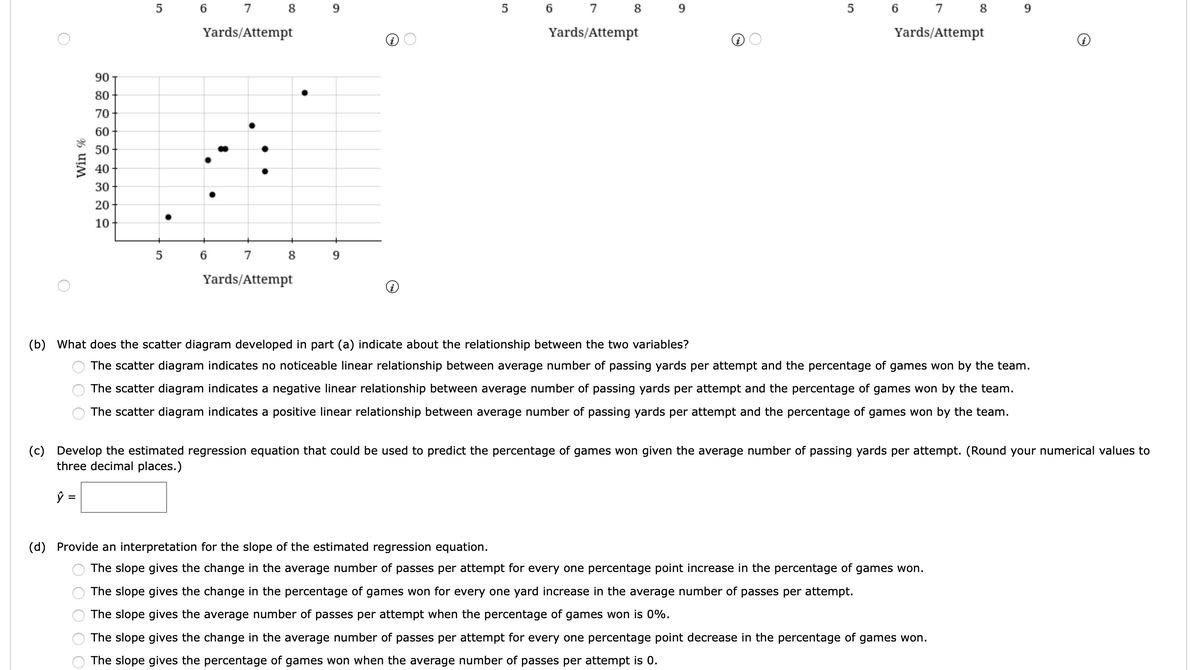
(b) What does the scatter diagram developed in part (a) indicate about the relationship between the two variables?
The scatter diagram indicates no noticeable linear relationship between average number of passing yards per attempt and the percentage of games won by the team.
The scatter diagram indicates a negative linear relationship between average number of passing yards per attempt and the percentage of games won by the team.
The scatter diagram indicates a positive linear relationship between average number of passing yards per attempt and the percentage of games won by the team.
(c) Develop the estimated regression equation that could be used to predict the percentage of games won given the average number of passing yards per attempt. (Round your numerical values to
three decimal places.)
(d) Provide an interpretation for the slope of the estimated regression equation.
The slope gives the change in the average number of passes per attempt for every one percentage point increase in the percentage of games won.
The slope gives the change in the percentage of games won for every one yard increase in the average number of passes per attempt.
The slope gives the average number of passes per attempt when the percentage of games won is 0%.
The slope gives the change in the average number of passes per attempt for every one percentage point decrease in the percentage of games won.
The slope gives the percentage of games won when the average number of passes per attempt is 0.
Win %
O O O

Transcribed Image Text:The National Football League (NFL) records a variety of performance data for individuals and teams. To investigate the importance of passing on the percentage of games won by a team, the following
data show the average number of passing yards per attempt (Yards/Attempt) and the percentage of games won (WinPct) for a random sample of 10 NFL teams for the 2011 season.t
Team
Yards/Attempt
WinPct
Arizona Cardinals
6.5
50
Atlanta Falcons
7.1
63
Carolina Panthers
7.4
38
Chicago Bears
6.4
50
Dallas Cowboys
7.4
50
New England Patriots
8.3
81
Philadelphia Eagles
7.4
50
Seattle Seahawks
6.1
44
St. Louis Rams
5.2
13
Tampa Bay Buccaneers
6.2
25
(a) Develop a scatter diagram with the number of passing yards per attempt on the horizontal axis and the percentage of games won on the vertical axis.
90
90
90
80
80
80
70
70
70
60
60
60
50
50
50
40
40
40
30
30
30
20
20
20
10
10
10
7
8
9.
5
7
8
5
7
8
9.
Yards/Attempt
Yards/Attempt
Yards/Attempt
% UIM
% UIM
Expert Solution
This question has been solved!
Explore an expertly crafted, step-by-step solution for a thorough understanding of key concepts.

Step by stepSolved in 2 steps with 1 images

Knowledge Booster


Learn more about
Need a deep-dive on the concept behind this application? Look no further. Learn more about this topic, statistics and related others by exploring similar questions and additional content below.Similar questions
- A person noted that the angle of elevation to the top of a tree was 65° at a distance of 11 feet from the tree. Using the diagram approximate the height of the tree. ? 11 festarrow_forward00 e 2.arrow_forwardpelotas saltarinas 10 þulgs 7 pulgs. 14 pulgs. A. 31 pulgs?. B. 616 pulgs?. C. 977 pulgs3. D. 980 pulgs3.arrow_forward
arrow_back_ios
SEE MORE QUESTIONS
arrow_forward_ios
Recommended textbooks for you
- MATLAB: An Introduction with ApplicationsStatisticsISBN:9781119256830Author:Amos GilatPublisher:John Wiley & Sons Inc
 Probability and Statistics for Engineering and th...StatisticsISBN:9781305251809Author:Jay L. DevorePublisher:Cengage Learning
 Statistics for The Behavioral Sciences (MindTap C...StatisticsISBN:9781305504912Author:Frederick J Gravetter, Larry B. WallnauPublisher:Cengage Learning
  Elementary Statistics: Picturing the World (7th E...StatisticsISBN:9780134683416Author:Ron Larson, Betsy FarberPublisher:PEARSON
 The Basic Practice of StatisticsStatisticsISBN:9781319042578Author:David S. Moore, William I. Notz, Michael A. FlignerPublisher:W. H. Freeman
 Introduction to the Practice of StatisticsStatisticsISBN:9781319013387Author:David S. Moore, George P. McCabe, Bruce A. CraigPublisher:W. H. Freeman
MATLAB: An Introduction with Applications
Statistics
ISBN:9781119256830
Author:Amos Gilat
Publisher:John Wiley & Sons Inc
Probability and Statistics for Engineering and th...
Statistics
ISBN:9781305251809
Author:Jay L. Devore
Publisher:Cengage Learning
Statistics for The Behavioral Sciences (MindTap C...
Statistics
ISBN:9781305504912
Author:Frederick J Gravetter, Larry B. Wallnau
Publisher:Cengage Learning
Elementary Statistics: Picturing the World (7th E...
Statistics
ISBN:9780134683416
Author:Ron Larson, Betsy Farber
Publisher:PEARSON
The Basic Practice of Statistics
Statistics
ISBN:9781319042578
Author:David S. Moore, William I. Notz, Michael A. Fligner
Publisher:W. H. Freeman
Introduction to the Practice of Statistics
Statistics
ISBN:9781319013387
Author:David S. Moore, George P. McCabe, Bruce A. Craig
Publisher:W. H. Freeman