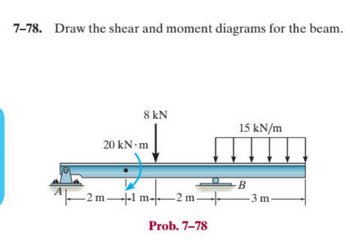
7-78. Draw the shear and moment diagrams for the beam. 8 kN 20 kN·m -2m+1 -2 m 1 m 2 m- 15 kN/m B -3 m- Prob. 7-78
Q: The accompanying table shows the number of wins and the number of strike-outs (SO) for 40 baseball…
A:
Q: The dotplot shows the distribution of passing rates for the bar exam at 185 law schools in the…
A: Reading a Box and Whisker PlotThe line splitting the box in two represents the median value. This…
Q: A psychologist is interested in determining whether immediate memory capacity is affected by sleep…
A: First, we need to calculate the mean (average) of each group. The mean is calculated by adding up…
Q: What is the difference in standard deviation based on n and standard deviation based on n-1? I ask…
A: Step 1: ObjectiveTo differentiate the standard deviation based on n and the standard deviation based…
Q: Canvas V→XC D Question 5 i A 文 X After viewing the regression test below, select the percentage of…
A: The question is asking for the percentage of the variability in gestational age that is explained by…
Q: 3.) If n=45 average x is 37.5 theta = 7.5 c=99% and zc = 2.58 what is the margin of error?
A: The margin of error is a statistic expressing the amount of random sampling error in a survey's…
Q: please solve this problem step by step and make it quick please
A: Given information:- 60% of the fencers use the foil as their main weapon- 25 fencers were randomly…
Q: please solve this problem step by step and make it quick please
A: The most important step is to analyze the given data correctly.
Q: Find the derivative of the function. h(x) = 1 h'(x) = Χ
A: To find the derivative of the function h(x)=x−2, we can use the power rule. First, rewrite the…
Q: Determine whether salaries in the following colleges increased after the last union contract was…
A: Step 1: State the HypothesesNull Hypothesis (Ho):In symbols: Ho: µD = 0In words: There is no…
Q: Consider the system of components connected as in the accompanying picture. Components 1 and 2 are…
A: To find the probability that the system works, we need to find all the conditions for the system to…
Q: 7-89. Draw the shear and moment diagrams for the shaft. The support at A is a thrust bearing and at…
A: Note: I hope this helps. Thank you.
Q: Type your name(s) here: Insert Histogram (FG%) Here 1. Calculate the average scores (M) and standard…
A: Using Excel, we can calculate the average (M) and standard deviation (SD) for each of the given…
Q: These question need to be solved using R with the given data, please do not provide AI solution ,…
A: Here is the combined R code for solving the problem using time series analysis techniques:# Step 1:…
Q: Canvas ← →X CO * Select the answer that best reports the results from the following Pearson's…
A: Pearson's correlation coefficient (r) measures the strength and direction of the linear relationship…
Q: In order to find probability, you can use this formula in Microsoft Excel: The best way to…
A:
Q: 10:43 PM Fri Sep 20 SDS 302 - Homework 2 ... B I U SA 1. = = = IQ scores are based on a normal model…
A: Step 1:When data normally distributed, population mean and population standard deviation are known…
Q: Ring size is an example of: O A. interval data OB. ratio-scaled data C. ordinal data OD. nominal…
A: Step 1: Identify the different types of data*Nominal data are data that label and categorize…
Q: About 15% of people in America use a certain social media website. In a group with 15 people (assume…
A: Step 1:Check conditions of binomial distribution -- characterstics of binomial distribution…
Q: Please help with HW, question is in image
A: A scatterplot visually displays the relationship between two variables, with each point representing…
Q: Find the z value such that 89% of the standard normal curve lies between −z and z. (Round your…
A: Step 1: Identify the appropriate distribution for the testSince the we are looking for the z-value…
Q: Refer to the accompanying data set and construct a 90%confidence interval estimate of the mean pulse…
A: To construct a 90% confidence interval for the mean pulse rates of adult females and males,…
Q: A physician group sees an average of 40 patients per hour. What is the probability that they would…
A: In this case, we are dealing with a Poisson distribution. The Poisson distribution is a probability…
Q: x- lim П COS 20 (2x) 220 (cos(x)-√sin(x)) 20
A: ANSWER :
Q: Approximate the critical numbers of the function on the open interval shown in the graph. Determine…
A: We have to find the critical points of the given function.Then we have classify these points as…
Q: 19. Please answer. Rainbow Irout, Inc. feeds Fingerling trout in special ponds and markets them when…
A:
Q: Not use ai please
A: Part (a): Test for the significance of each independent variable as it enters the modelTo test the…
Q: Kindly break your response down so i can follow accordingly, as i am not someone with a statistics…
A: Let's give it a try. To provide precise answer, I believe further reference is necessary, but I will…
Q: Canvas -X COAD A文 X Question 6 The results from the following regression test indicate that maternal…
A: The regression output provides a lot of information. The key values to look at to determine the…
Q: please solve this problem step by step and make it quick please
A: Given:The average percent of fat calories (mean) is μ=35.The standard deviation is σ=10.Sample size…
Q: A sample was done, collecting the data below. Calculate the standard deviation, to on decimal place.…
A: Step 1Here given data,18,3,2,6,23 Total number of data is 5.n=5 Sample mean…
Q: A population grows according to an exponential growth model, with Po = 50 and P₁ = 80 Complete the…
A:
Q: Name MAT 115 Test I Part III - Use the space provided to construct tables and graphs Romeo II.…
A: Step 1: Step 2: Step 3: Step 4:
Q: The answers typed in the boxes are wrong.
A:
Q: Question 2 The University Council in interested in studying the average GPA of students in four…
A: First, we need to calculate the mean GPA for each program. The mean is calculated by summing all the…
Q: It has been suggested that the highest priority of retirees is travel. Thus, a study was conducted…
A: Step 1:formula to find expected frequency Ei,j=NRi ×CjwhereEi,j =expected frequency or value…
Q: Temperature transducers of a certain type are shipped in batches of 50. A sample of 60 batches was…
A: Step 1:Part (a): Determine frequencies and relative frequencies for each number of nonconforming…
Q: The logarithmic equation is a nonlinear regression equation of the form y = a + b In x. Use…
A: I used desmos.com to get the regression line.Input the data first.Then enter this formula:And desmos…
Q: Make the explanation concise, if you can. I don't want to have to write more than a couple pages
A: Given:mean µ = 68standard deviation σ = 27sample size n = 30Let x̄ represent the sample mean level…
Q: I need help
A:
Q: *5.53 b) – Make sure you explain using probability if they are independent or associated. You need…
A: Step 1: It is given that a report of a research centre that asked people who got their news from…
Q: A random sample of 100 employees at a company shows that 42 drive US made automobiles (the rest…
A:
Q: Hi I want to ask question in the first picture. T3Q1 is shown in the second picture.
A: Question: Part (i): Show that F₀,₀(s) = 1 - √(1 - 4pqs²) for |s| < 1 1) From T3Q1, we know…
Q: A simple random sample of size nequals=1111 is obtained from a population with muμequals=6767 and…
A: Part 1)a) What must be true regarding the distribution of the population? Step 1: Identify the…
Q: Two marbles are selected at random and without replacement from a box containing two blue marbles…
A: Step 1:Given that :A box contains :Number of blue marbles = 2 Number of red marbles = 3 Total number…
Q: The following report is from the National Highway Safety Administration, and it is based on over…
A: Approach to solving the question:We are given the distribution of fatalities across different types…
Q: I need help to analyze or interpret the histogram result for central tendency, variability, shape,…
A: Based on the histogram you provided, here is an analysis of central tendency, variability, shape,…
Q: 1. The proportion of overweight bags that are checked on airlines is 6.3%. If you were to randomly…
A: Question: Given: - The proportion of overweight bags is 6.3% = 0.063 - We are randomly selecting 25…
Q: Help please
A: Setting Up Hypotheses:Null hypothesis (H₀): The variances of the yields for fertilizer A and…
Q: Case Study II: The number of alignment errors observed at final inspection of a certain model of…
A: Here's a step-by-step solution for creating the c-chart for Part (A) of the case study:Step 1:…
Need help and more explanation.
Step by step
Solved in 2 steps with 2 images