
MATLAB: An Introduction with Applications
6th Edition
ISBN: 9781119256830
Author: Amos Gilat
Publisher: John Wiley & Sons Inc
expand_more
expand_more
format_list_bulleted
Related questions
Concept explainers
Question
Bridges covered There is a relationship between the age
of a bridge in Tompkins County, New York, and its con-
dition as found by inspection. Below is a graph of data.
dition as found by inspection. Below is a graph of data.
Two of bridges are considerably older than the rest. The
oldest covered bridge in daily use in New York State was
built in 1853 and was recently judged to have a condition
of 4.523. Another bridge with a rating of 5.4 was built in
oldest covered bridge in daily use in New York State was
built in 1853 and was recently judged to have a condition
of 4.523. Another bridge with a rating of 5.4 was built in
1865. Also below is the regression analysis for this rela-
tionship using all 196 bridges.
tionship using all 196 bridges.
a) If we use this regression to predict the condition of the
oldest bridge, what would its residual be?
We removed the 1853 and 1865 bridges from the analysis
and here are the results:
oldest bridge, what would its residual be?
We removed the 1853 and 1865 bridges from the analysis
and here are the results:
Dependent variable is Condition
R@squared = 46.55, s = 0.7354
Variable Coefficient
Constant -40.7546
Year 0.02343
b) How were these two old bridges affecting the
regression?
c) The 1853 bridge was extensively restored in 1972.
Does that better explain its condition?
R@squared = 46.55, s = 0.7354
Variable Coefficient
Constant -40.7546
Year 0.02343
b) How were these two old bridges affecting the
regression?
c) The 1853 bridge was extensively restored in 1972.
Does that better explain its condition?
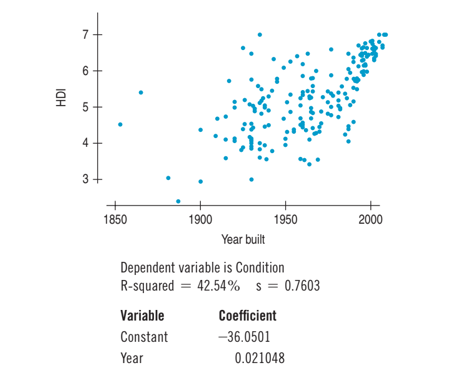

Transcribed Image Text:7+
6 +
4 +
3+
1850
1900
1950
2000
Year built
Dependent variable is Condition
R-squared = 42.54% s = 0.7603
Variable
Coefficient
Constant
-36.0501
Year
0.021048
HDI
Expert Solution
This question has been solved!
Explore an expertly crafted, step-by-step solution for a thorough understanding of key concepts.

This is a popular solution

Trending nowThis is a popular solution!

Step by stepSolved in 5 steps with 5 images

Knowledge Booster


Learn more about
Need a deep-dive on the concept behind this application? Look no further. Learn more about this topic, statistics and related others by exploring similar questions and additional content below.Similar questions
- Typed and correct answer please. I will rate accordingly.arrow_forwardA researcher collected information about the height of different flowers. What type of data is heightarrow_forwardLook the image and answer the following questions: a. What is the independent variable (IV)? b. How many levels do we have for the IV? C. What is the level of measurement for the IV? d. What is the DV (remember, the DV is the data)? e.What is the level of measurement of the DV? f. Why a Bar graph is the best graph to display this data? Explain g. Construct a Bar graph that incorporates all the information in this table. h. Looking at your graph, do you think that the relaxation training really worked. Explain your answer.arrow_forward
- 2. For the data set below, do a complete boxplot analysis. This includes finding the quartiles, the range, the interquartile range, inner fences, and outer fences. Make sure you draw the graph. Then tell me whether the highest observation is reliable, a mild outlier, or an extreme outlier. 9, 11, 13, 14, 16, 17, 17, 18, 19, 20, 35.arrow_forwardWith four quartiles pleasearrow_forwardA congressperson wants to come up with a single value to describe the prices of homes in their district. However, their district consists of a few homes that are extremely expensive compared to the others. Which descriptive statistic should they use? a. Range b. Mode c. Median d. Meanarrow_forward
- 3. The number of goals scored by Wayne Gretzky was recorded for seasons 1978 – 1999. (Please note the data set has been ordered from smallest to the largest for your convenience). 5, 9, 11, 16, 23, 23, 31, 38, 40, 40, 41, 46, 51, 52, 54, 55, 62, 71, 73, 87, 92 A. Construct a stem-and-leaf display for the data and describe the shape of the distribution (symmetric, skewed left, skewed right, bell-shaped, etc., any obvious outliers). B. What is the fraction of the data that is less than or equal to 31? C. Given that Ex, = 920 and Ex = 52 436 find the mean and standard deviation. D. Find the (i) median, (ii) Q1, (iii)Q:, (iv) the interquartile range (IQR), (v) the lower and upper fences. E. Construct a Box-plot for the data. What are your conclusions about the shape of the distribution? Compare with the results in Part A. F. Would the mean or the median be the most suitable measure to use to represent the central location of this distribution? Give reasons for your answer.arrow_forwardDetermine if the data set is a population or a sample. The incomes of every employee at an amusement park.arrow_forwardDetermine which of the four levels of measurement (nominal, ordinal, interval, ratio) is most appropriate for the data below. Years in which U.S. presidents were inaugurated Choose the correct answer below. O A. The nominal level of measurement is most appropriate because the data cannot be ordered. OB. The ratio level of measurement is most appropriate because the data can be ordered, differences (obtained by subtraction) can be found and are meaningful, and there is a natural starting point. OC. The ordinal level of measurement is most appropriate because the data can be ordered, but differences (obtained by subtraction) cannot be found or are meaningless. OD. The interval level of measurement is most appropriate because the data can be ordered, differences can be found and are meaningful, and there is no natural starting zero point. DELL Nexarrow_forward
- . We consider the data below:2,4,6,9,5,4Which of the following expressions gives the median of the data?A. 4.5 years;B. 4.0 years;C. 3.0 years;D. 8.0 years.arrow_forwardA random sample of n=102 was asked what color they most liked to wear as one question in a survey. What type of graph would be best to display the data below? Note: please do not capitalize your answers when typing them. Color Blue Green Red Purple Yellow Orange # of people 20 15 32 18 15 pie graph histogram O box-and-whiskersarrow_forwardPlease refer to the picture attached.arrow_forward
arrow_back_ios
SEE MORE QUESTIONS
arrow_forward_ios
Recommended textbooks for you
- MATLAB: An Introduction with ApplicationsStatisticsISBN:9781119256830Author:Amos GilatPublisher:John Wiley & Sons Inc
 Probability and Statistics for Engineering and th...StatisticsISBN:9781305251809Author:Jay L. DevorePublisher:Cengage Learning
 Statistics for The Behavioral Sciences (MindTap C...StatisticsISBN:9781305504912Author:Frederick J Gravetter, Larry B. WallnauPublisher:Cengage Learning
  Elementary Statistics: Picturing the World (7th E...StatisticsISBN:9780134683416Author:Ron Larson, Betsy FarberPublisher:PEARSON
 The Basic Practice of StatisticsStatisticsISBN:9781319042578Author:David S. Moore, William I. Notz, Michael A. FlignerPublisher:W. H. Freeman
 Introduction to the Practice of StatisticsStatisticsISBN:9781319013387Author:David S. Moore, George P. McCabe, Bruce A. CraigPublisher:W. H. Freeman
MATLAB: An Introduction with Applications
Statistics
ISBN:9781119256830
Author:Amos Gilat
Publisher:John Wiley & Sons Inc
Probability and Statistics for Engineering and th...
Statistics
ISBN:9781305251809
Author:Jay L. Devore
Publisher:Cengage Learning
Statistics for The Behavioral Sciences (MindTap C...
Statistics
ISBN:9781305504912
Author:Frederick J Gravetter, Larry B. Wallnau
Publisher:Cengage Learning
Elementary Statistics: Picturing the World (7th E...
Statistics
ISBN:9780134683416
Author:Ron Larson, Betsy Farber
Publisher:PEARSON
The Basic Practice of Statistics
Statistics
ISBN:9781319042578
Author:David S. Moore, William I. Notz, Michael A. Fligner
Publisher:W. H. Freeman
Introduction to the Practice of Statistics
Statistics
ISBN:9781319013387
Author:David S. Moore, George P. McCabe, Bruce A. Craig
Publisher:W. H. Freeman