
MATLAB: An Introduction with Applications
6th Edition
ISBN: 9781119256830
Author: Amos Gilat
Publisher: John Wiley & Sons Inc
expand_more
expand_more
format_list_bulleted
Related questions
Question
Let the differences be the accidents on the 6th minus the accidents on the 13th.
The null hypothesis is H0: μd <, ≠, =, or > _______________.
The alternative hypothesis is H1: μd <, ≠, =, or > _______________.
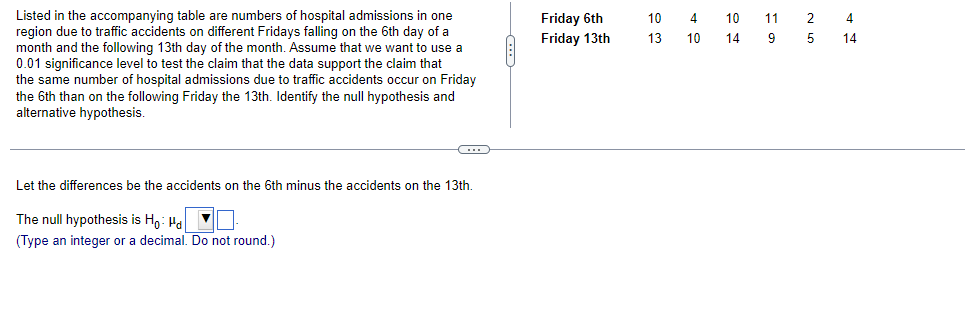

Transcribed Image Text:Listed in the accompanying table are numbers of hospital admissions in one
region due to traffic accidents on different Fridays falling on the 6th day of a
month and the following 13th day of the month. Assume that we want to use a
0.01 significance level to test the claim that the data support the claim that
the same number of hospital admissions due to traffic accidents occur on Friday
the 6th than on the following Friday the 13th. Identify the null hypothesis and
alternative hypothesis.
Let the differences be the accidents on the 6th minus the accidents on the 13th.
The null hypothesis is Ho: Hd
(Type an integer or a decimal. Do not round.)
Friday 6th
Friday 13th
10 4
13
10
10 11
9
14
2
4
5 14
Expert Solution
This question has been solved!
Explore an expertly crafted, step-by-step solution for a thorough understanding of key concepts.

This is a popular solution

Trending nowThis is a popular solution!

Step by stepSolved in 2 steps

Knowledge Booster

Similar questions
- taking the QUESTION 3 Marie makes a score of 60 on an exam (e.g., her "little x" = 60). Suppose that the percentile associated with a score of 60 just happens to be the 60th percentile. This means 60% of the class scored above her 60% of the class scored below her 60% of the class made a score of 60 O her Z-score +1 or greater OUESTION 4 Save All Ans Click Save and Submit to save and submit. Click Save All Answers to save all answers. 3325 Chapter 11.pptx 3325 Chapter 1. pptx 3325 Chapter 1.pptx P 3325 Chapter 14.pptx MacBook Airarrow_forwardSolution to B, C and Darrow_forwardchapter 8, question a simple random sample size n=13 is obtained from a population u=66 and q=15 the population is normally distributed it is normal with ux =66, and qx = 15 over square root of 13. B. P(xbar less than 69.4) ______________________ C.p(xbar greater than or equal to 67.9) _______________arrow_forward
- You are conducting a test of homogeneity for the claim that two different populations have the same proportions of the following two characteristics. Here is the sample data. Category Population#1 Population#2 A 18 30 B 52 82 What is the chi-square test-statistic for this data?χ2=Report all answers accurate to three decimal places.arrow_forwardHow can I find this in the chart and work it out ?arrow_forwardAn investigator wants to estimate caffeine consumption in high school students. How many students would be required to estimate the proportion of students who consume coffee? Suppose we want the estimate to be within 5% of the true proportion with 95% confidence. Alpha = ________ Z= ________ p= ________ E = ________ n= ________arrow_forward
- Question 2 O 0 0 12 02 06 072 What is the variance of the following: M(t) = [1 - 6t] -2 Search 2arrow_forwardX P(X = x) 0 0.4086 1 0.4108 2 0.1546 3 0.0246 4 0.0014 What is the mean of the random variable? ___________ What is the standard deviation of the random variable? __________arrow_forward#143. Global Temperatures A research group measured the Earth's globally averaged temperature T during June in 4 different years, and obtained the data listed in the table. Year T (K) 1994 286.73 1 2002 286.83 2 2008 286.90 3 2015 286.98 4 rows x 2 columns What is the expected global temperature in June 2016? I number (rtol=0.01, atol=0.0001) Give a prediction interval for the temperature in June 2017 at the 86% level. Ib number (rtol=0.01, atol=0.0001) ub number (rtol=0.01, atol=0.0001) In what year are you at least 90% confident that the expected June temperature first exceeded 286.78 K? Year number (rtol=0.01, atol=0.0001) A climate-skeptic questions whether the Earth is really getting warmer. How could you test this hypothesis. Compute the relevant test statistic and its associated P-value. (Note: report the absolute value for the statistic) t-statistic number (rtol=0.01, atol=0.0001) P-value number (rtol=0.01, atol=0.0001) What is your conclusion at a 5% significance level? O (a)…arrow_forward
arrow_back_ios
SEE MORE QUESTIONS
arrow_forward_ios
Recommended textbooks for you
- MATLAB: An Introduction with ApplicationsStatisticsISBN:9781119256830Author:Amos GilatPublisher:John Wiley & Sons Inc
 Probability and Statistics for Engineering and th...StatisticsISBN:9781305251809Author:Jay L. DevorePublisher:Cengage Learning
 Statistics for The Behavioral Sciences (MindTap C...StatisticsISBN:9781305504912Author:Frederick J Gravetter, Larry B. WallnauPublisher:Cengage Learning
  Elementary Statistics: Picturing the World (7th E...StatisticsISBN:9780134683416Author:Ron Larson, Betsy FarberPublisher:PEARSON
 The Basic Practice of StatisticsStatisticsISBN:9781319042578Author:David S. Moore, William I. Notz, Michael A. FlignerPublisher:W. H. Freeman
 Introduction to the Practice of StatisticsStatisticsISBN:9781319013387Author:David S. Moore, George P. McCabe, Bruce A. CraigPublisher:W. H. Freeman
MATLAB: An Introduction with Applications
Statistics
ISBN:9781119256830
Author:Amos Gilat
Publisher:John Wiley & Sons Inc
Probability and Statistics for Engineering and th...
Statistics
ISBN:9781305251809
Author:Jay L. Devore
Publisher:Cengage Learning
Statistics for The Behavioral Sciences (MindTap C...
Statistics
ISBN:9781305504912
Author:Frederick J Gravetter, Larry B. Wallnau
Publisher:Cengage Learning
Elementary Statistics: Picturing the World (7th E...
Statistics
ISBN:9780134683416
Author:Ron Larson, Betsy Farber
Publisher:PEARSON
The Basic Practice of Statistics
Statistics
ISBN:9781319042578
Author:David S. Moore, William I. Notz, Michael A. Fligner
Publisher:W. H. Freeman
Introduction to the Practice of Statistics
Statistics
ISBN:9781319013387
Author:David S. Moore, George P. McCabe, Bruce A. Craig
Publisher:W. H. Freeman