
MATLAB: An Introduction with Applications
6th Edition
ISBN: 9781119256830
Author: Amos Gilat
Publisher: John Wiley & Sons Inc
expand_more
expand_more
format_list_bulleted
Related questions
Question
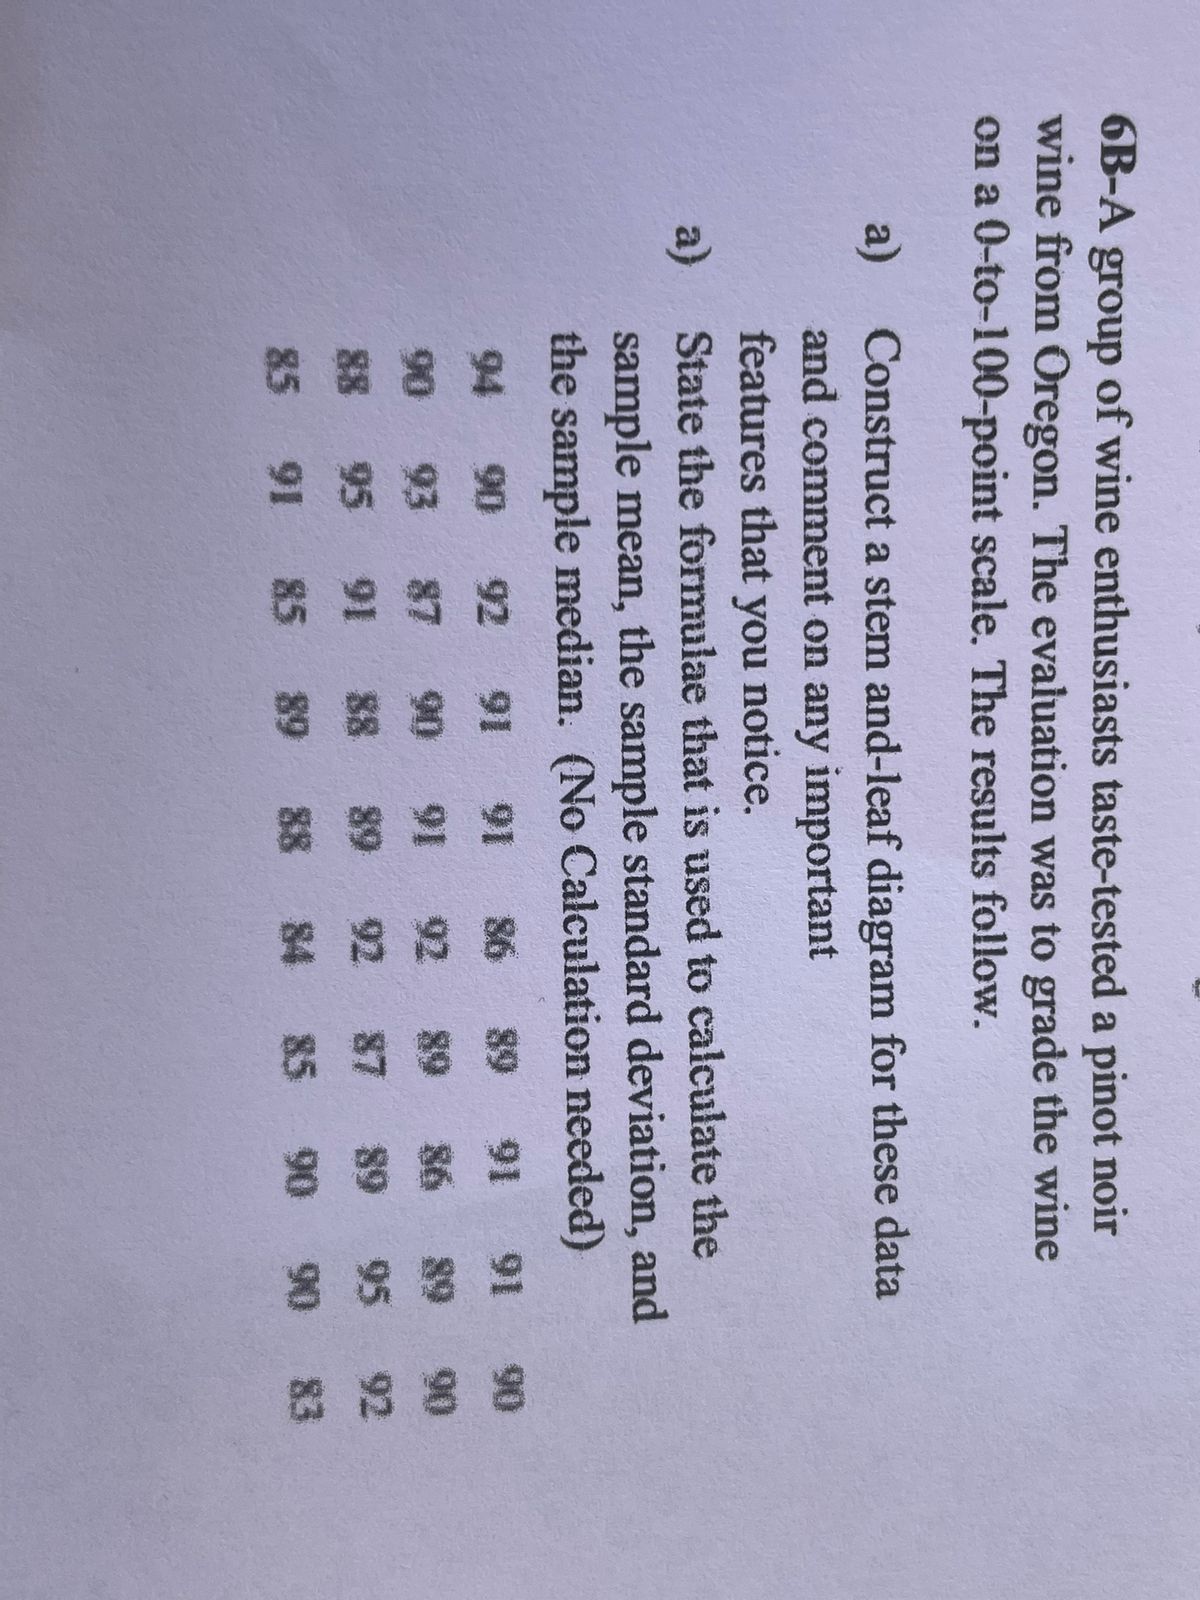

Transcribed Image Text:6B-A group of wine enthusiasts taste-tested a pinot noir
wine from Oregon. The evaluation was to grade the wine
on a 0-to-100-point scale. The results follow.
a)
a)
Construct a stem and-leaf diagram for these data
and comment on any important
features that you notice.
State the formulae that is used to calculate the
sample mean, the sample standard deviation, and
the sample median. (No Calculation needed)
94 90
92
89
91
91
90
90
93
87
90
89
86
89
90
88
195 91 88 89
92 87 89
95 92
85
91 85 89 88 84 85 90 90 83
91
91 92

Transcribed Image Text:Cumulative Standard Normal Distribution
$(z)= [
2.0
2.1
ساس
1
√2π
3.6
3.7
3.8
3.9
du
Z
0.00
0.01
0.02
0.03
0.04
0.51595
0.55567
0.2
0.3
0.4
0.5
0.79389
0.79673
1.1
1.2
1.3
1.7
0.95543
1.8
0.96407
0.96485
0.0 0.50000 0.50399 0.50798 0.51197
0.1 0.53983 0.54379 0.54776 0.55172
0.57926 0.58317 0.58706 0.59095 0.59483
0.61791 0.62172 0.62551 0.62930 0.63307
0.65542 0.65910 0.62276 0.66640 0.67003
0.69146 0.69497 0.69847 0.70194 0.70540
0.6 0.72575 0.72907 0.73237 0.73565 0.73891
0.7 0.75803 0.76115 0.76424 0.76730 0.77035
0.8 0.78814 0.79103
0.79954
0.9 0.81594 0.81859 0.82121 0.82381 0.82639
1.0 0.84134 0.84375 0.84613 0.84849 0.85083
0.86433 0.86650 0.86864 0.87076 0.87285
0.88493 0.88686 0.88877 0.89065 0.89251
0.90320 0.90490 0.90658 0.90824 0.90988
1.4 0.91924 0.92073 0.92219 0.92364 0.92506
1.5 0.93319 0.93448 0.93574 0.93699 0.93822
1.6
0.94520 0.94630 0.94738 0.94845 0.94950
0.95637 0.95728 0.95818 0.95907
0.96637
0.96562
0.96711
0.97320 0.97381
0.97725 0.97778 0.97831 0.97882 0.97932
0.98214 0.98257 0.98300 0.98341 0.98382
0.98610 0.98645 0.98679 0.98713 0.98745
2.3 0.98928 0.98956 0.98983 0.99010 0.99036
2.4 0.99180 0.99202 0.99224 0.99245 0.99266
0.99413 0.99430
0.99379 0.99396
0.99446
2.5
0.99573 0.99585
0.99560
0.99534 0.99547
2.7 0.99653 0.99664 0.99674 0.99683 0.99693
2.8 0.99744 0.99752 0.99760 0.99767 0.99774
2.9 0.99813 0.99819 0.99825 0.99831 0.99836
3.0 0.99865 0.99869 0.99874 0.99878 0.99882
3.1 0.99903 0.99906 0.99910 0.99913 0.99916
3.2 0.99931 0.99934 0.99936 0.99938 0.99940
3.3 0.99952 0.99953 0.99955 0.99957 0.99958
3.4 0.99966 0.99968
0.99970
0.99969
0.99971
0.99980
0.99977 0.99978 0.99978 0.99979
0.99984 0.99985 0.99985 0.99986 0.99986
0.99989 0.99990
0.97128
0.97193 0.97257
2.2
2.6
3.5
0.99990 0.99990
0.99991
0.99993 0.99993 0.99993 0.99994 0.99994
0.99995 0.99995 0.99996 0.99996 0.99996
0
2
■ APPENDIX II
Cumulative Standard Normal Distribution (continued)
(z)=L
√√2n
du
z
0.05
0.06
Z
0.07
0.08
0.09
0.0 0.51994 0.52392 0.52790 0.53188 0.53586 0.0
0.1 0.55962 0.56356 0.56749 0.57142 0.57534 0.1
0.2 0.59871 0.60257 0.60642
0.61409
0.61026
0.2
0.3
0.64431 0.64803
0.63683
0.65173
0.64058
0.3
0.4 0.67364 0.67724 0.68082 0.68438 0.68793 0.4
0.5 0.70884 0.71226 0.71566 0.71904 0.72240 0.5
0.6 0.74215 0.74537 0.74857 0.75175
0.6
0.75490
0.77337 0.77637
0.7
0.77935 0.78230 0.78523 0.7
0.8
0.80510
0.80234
0.80785
0.81327
0.81057
0.8
0.9
0.83147
0.82894
0.83397
0.83891
0.83646
0.9
1.0
0.86214
1.0 0.85314 0.85543 0.85769 0.85993
1.1
0.87900 0.88100 0.88297
1.1 0.87493
0.87697
1.2
1.2
0.89616
0.89435
0.89796 0.89973 0.90147
1.3
0.91308
0.91149
0.91465
0.91773
0.91621
1.3
1.4 0.92647 0.92785 0.92922
1.4
0.93056 0.93189
1.5 0.93943 0.94062 0.94179 0.94295 0.94408 1.5
1.6 0.95053 0.95154 0.95254 0.95352
1.6
0.95448
0.95994
1.7
0.96080 0.96164
1.7
0.96246 0.96327
1.8
1.8
0.96784 0.96856 0.96926
0.97062
0.96995
1.9
0.97441
0.97615 0.97670
1.9
0.97500 0.97558
2.0 0.97982 0.98030
0.98124
0.98077
0.98169 2.0
2.1 0.98422 0.98461 0.98500 0.98537 0.98574 2.1
2.2 0.98778 0.98809 0.98840 0.98870 0.98899 2.2
2.3 0.99061 0.99086 0.99111 0.99134 0.99158 2.3
2.4 0.99286 0.99305 0.99324 0.99343 0.99361 2.4
2.5 0.99461 0.99477 0.99492 0.99506 0.99520 2.5
2.6 0.99598 0.99609 0.99621 0.99632 0.99643 2.6
2.7 0.99702 0.99711 0.99720 0.99728
2.7
0.99736
2.8
0.99781
0.99795
0.99788
0.99807
0.99801
2.8
2.9 0.99841 0.99846 0.99851 0.99856 0.99861 2.9
3.0 0.99886 0.99889 0.99893 0.99897 0.99900 3.0
3.1 0.99918 0.99921 0.99924 0.99926 0.99929 3.1
3.2 0.99942 0.99944 0.99946 0.99948 0.99950 3.2
3.3 0.99960 0.99961 0.99962 0.99964 0.99965 3.3
3.4 0.99972 0.99973 0.99974 0.99975 0.99976 3.4
3.5 0.99981 0.99981 0.99982 0.99983 0.99983 3.5
3.6 0.99987 0.99987 0.99988 0.99988 0.99989 3.6
3.7 0.99991 0.99992 0.99992 0.99992 0.99992 3.7
3.8 0.99994 0.99994
3.8
0.99995 0.99995 0.99995
3.9 0.99996 0.99996 0.99996 0.99997 0.99997 3.9
Expert Solution
This question has been solved!
Explore an expertly crafted, step-by-step solution for a thorough understanding of key concepts.

This is a popular solution

Trending nowThis is a popular solution!

Step by stepSolved in 3 steps with 3 images

Knowledge Booster

Similar questions
- In Exercises, we have provided simple data sets for you to practice the basics of finding a a.population mean.b.population standard deviation.1, 9, 8, 4, 3arrow_forwardPlease find the range, sample standard deviation, and interquartile range (IQR) of the following data set. 23 30 37 53 62 range sample standard deviation IQR = = 88 93 95 95 98 (Please enter an exact answer.) (Please show your answer to one decimal place.) (Please enter an exact answer.)arrow_forwardIn Exercises, we have provided simple data sets for you to practice the basics of finding a a.population mean.b.population standard deviation.1, 2, 4, 4arrow_forward
- Calculate the range, variance and standard deviation for the following sample data. Scores: 10, 7, 9, 1, 2, 0, 6arrow_forwardGiven the sample data {1, 1, 3, 4, 6}.Calculate the mean.Calculate the standard deviation.arrow_forwardAn instructor wanted to know if his students are better at math or writing. He had students take both a math and then a writing test and he compared the results using SPSS. He found the following results: ( look at graphs ) a. What test was done?b. Report results in APA style.arrow_forward
- The ages in years of a random sample of shoppers at a gaming store are shown. Determine the range, mean, variance, and standard deviation of the sample data set 12,17,23,14,17,16,20,17,13,15arrow_forwardCalculate the mean, median and sample standard deviation for the following data. 1, 5, 2, 6, 8arrow_forwardDetermine the mean of the following data set: 21, 19, 2, 31, 9, 45, 40, 52, 83 State the mean value rounded to the nearest tenth.arrow_forward
arrow_back_ios
arrow_forward_ios
Recommended textbooks for you
- MATLAB: An Introduction with ApplicationsStatisticsISBN:9781119256830Author:Amos GilatPublisher:John Wiley & Sons Inc
 Probability and Statistics for Engineering and th...StatisticsISBN:9781305251809Author:Jay L. DevorePublisher:Cengage Learning
 Statistics for The Behavioral Sciences (MindTap C...StatisticsISBN:9781305504912Author:Frederick J Gravetter, Larry B. WallnauPublisher:Cengage Learning
  Elementary Statistics: Picturing the World (7th E...StatisticsISBN:9780134683416Author:Ron Larson, Betsy FarberPublisher:PEARSON
 The Basic Practice of StatisticsStatisticsISBN:9781319042578Author:David S. Moore, William I. Notz, Michael A. FlignerPublisher:W. H. Freeman
 Introduction to the Practice of StatisticsStatisticsISBN:9781319013387Author:David S. Moore, George P. McCabe, Bruce A. CraigPublisher:W. H. Freeman
MATLAB: An Introduction with Applications
Statistics
ISBN:9781119256830
Author:Amos Gilat
Publisher:John Wiley & Sons Inc
Probability and Statistics for Engineering and th...
Statistics
ISBN:9781305251809
Author:Jay L. Devore
Publisher:Cengage Learning
Statistics for The Behavioral Sciences (MindTap C...
Statistics
ISBN:9781305504912
Author:Frederick J Gravetter, Larry B. Wallnau
Publisher:Cengage Learning
Elementary Statistics: Picturing the World (7th E...
Statistics
ISBN:9780134683416
Author:Ron Larson, Betsy Farber
Publisher:PEARSON
The Basic Practice of Statistics
Statistics
ISBN:9781319042578
Author:David S. Moore, William I. Notz, Michael A. Fligner
Publisher:W. H. Freeman
Introduction to the Practice of Statistics
Statistics
ISBN:9781319013387
Author:David S. Moore, George P. McCabe, Bruce A. Craig
Publisher:W. H. Freeman