
A First Course in Probability (10th Edition)
10th Edition
ISBN: 9780134753119
Author: Sheldon Ross
Publisher: PEARSON
expand_more
expand_more
format_list_bulleted
Related questions
Question
Help please! please answer A,B,C. TY!
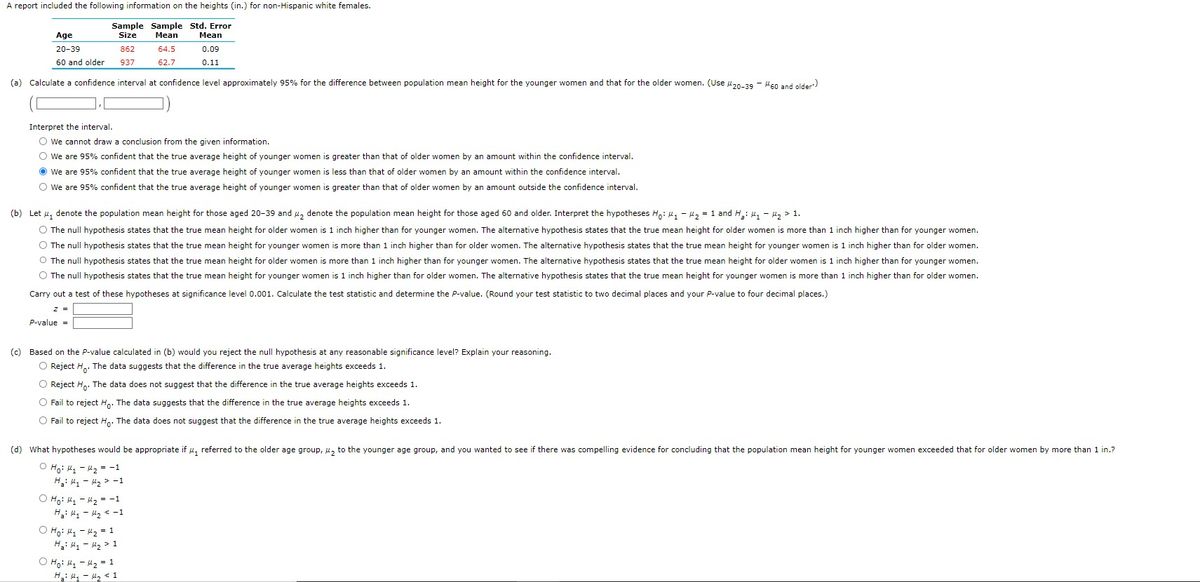

Transcribed Image Text:A report included the following information on the heights (in.) for non-Hispanic white females.
Sample Sample Std. Error
Size
Mean
Mean
0.09
0.11
Age
20-39
60 and older
(a) Calculate a confidence interval at confidence level approximately 95% for the difference between population mean height for the younger women and that for the older women. (Use 20-39 - 60 and older')
Interpret the interval.
O We cannot draw a conclusion from the given information.
O We are 95% confident that the true average height of younger women is greater than that of older women by an amount within the confidence interval.
Ⓒ We are 95% confident that the true average height of younger women is less than that of older women by an amount within the confidence interval.
O We are 95% confident that the true average height of younger women is greater than that of older women by an amount outside the confidence interval.
z =
(b) Let , denote the population mean height for those aged 20-39 and ₂ denote the population mean height for those aged 60 and older. Interpret the hypotheses Ho: ₁ - ₂ = 1 and ₂: M₁ - ₂1.
The null hypothesis states that the true mean height for older women is 1 inch higher than for younger women. The alternative hypothesis states that the true mean height for older women is more than 1 inch higher than for younger women.
O The null hypothesis states that the true mean height for younger women is more than 1 inch higher than for older women. The alternative hypothesis states that the true mean height for younger women is 1 inch higher than for older women.
The null hypothesis states that the true mean height for older women is more than 1 inch higher than for younger women. The alternative hypothesis states that the true mean height for older women is 1 inch higher than for younger women.
O The null hypothesis states that the true mean height for younger women is 1 inch higher than for older women. The alternative hypothesis states that the true mean height for younger women is more than 1 inch higher than for older women.
Carry out a test of these hypotheses at significance level 0.001. Calculate the test statistic and determine the P-value. (Round your test statistic to two decimal places and your P-value to four decimal places.)
P-value =
862
937
(c) Based on the P-value calculated in (b) would you reject the null hypothesis at any reasonable significance level? Explain your reasoning.
O Reject Ho. The data suggests that the difference in the true average heights exceeds 1.
O Reject Ho. The data does not suggest that the difference in the true average heights exceeds 1.
O Fail to reject Ho. The data suggests that the difference in the true average heights exceeds 1.
O Fail to reject Ho. The data does not suggest that the difference in the true average heights exceeds 1.
O Ho: M₁
Hai H₁
64.5
62.7
(d) What hypotheses would be appropriate if , referred to the older age group, ₂ to the younger age group, and you wanted to see if there was compelling evidence for concluding that the population mean height for younger women exceeded that for older women by more than 1 in.?
O Ho: M₁
M₂ = -1
Ha: M₂
M₂ -1
M₂ = -1
H₂ < -1
O Ho: M₁ - 1₂ = 1
Hai M₁
M₂ > 1
Ho: M₁
M₂ = 1
H₂: My - M₂ < 1
Expert Solution
This question has been solved!
Explore an expertly crafted, step-by-step solution for a thorough understanding of key concepts.

This is a popular solution

Trending nowThis is a popular solution!

Step by stepSolved in 2 steps with 2 images

Knowledge Booster

Similar questions
- May i have this hand writtenarrow_forwardcould u please help me with question a and carrow_forwardFor following function, select (on the same set of coordinate axes) a graph of function for c = 3, 1 and–3. [x²+c,x<0 -x2+c, x20 f(x) = -5 -4 -3 -2\-1. 5 3 4 2+ -3 2 + -5 -4 -3 -2 + 3 4 5 1 2 -2 -3 -5arrow_forward
arrow_back_ios
arrow_forward_ios
Recommended textbooks for you
- A First Course in Probability (10th Edition)ProbabilityISBN:9780134753119Author:Sheldon RossPublisher:PEARSON

A First Course in Probability (10th Edition)
Probability
ISBN:9780134753119
Author:Sheldon Ross
Publisher:PEARSON