
MATLAB: An Introduction with Applications
6th Edition
ISBN: 9781119256830
Author: Amos Gilat
Publisher: John Wiley & Sons Inc
expand_more
expand_more
format_list_bulleted
Related questions
Question
Hi, I added the imagine that the question is referring to. Thanks

Transcribed Image Text:P(x)
0.16
0.14
0.12
0.10
0.08
0.06
0.04
0.02
0.00
6
8
10
12
14
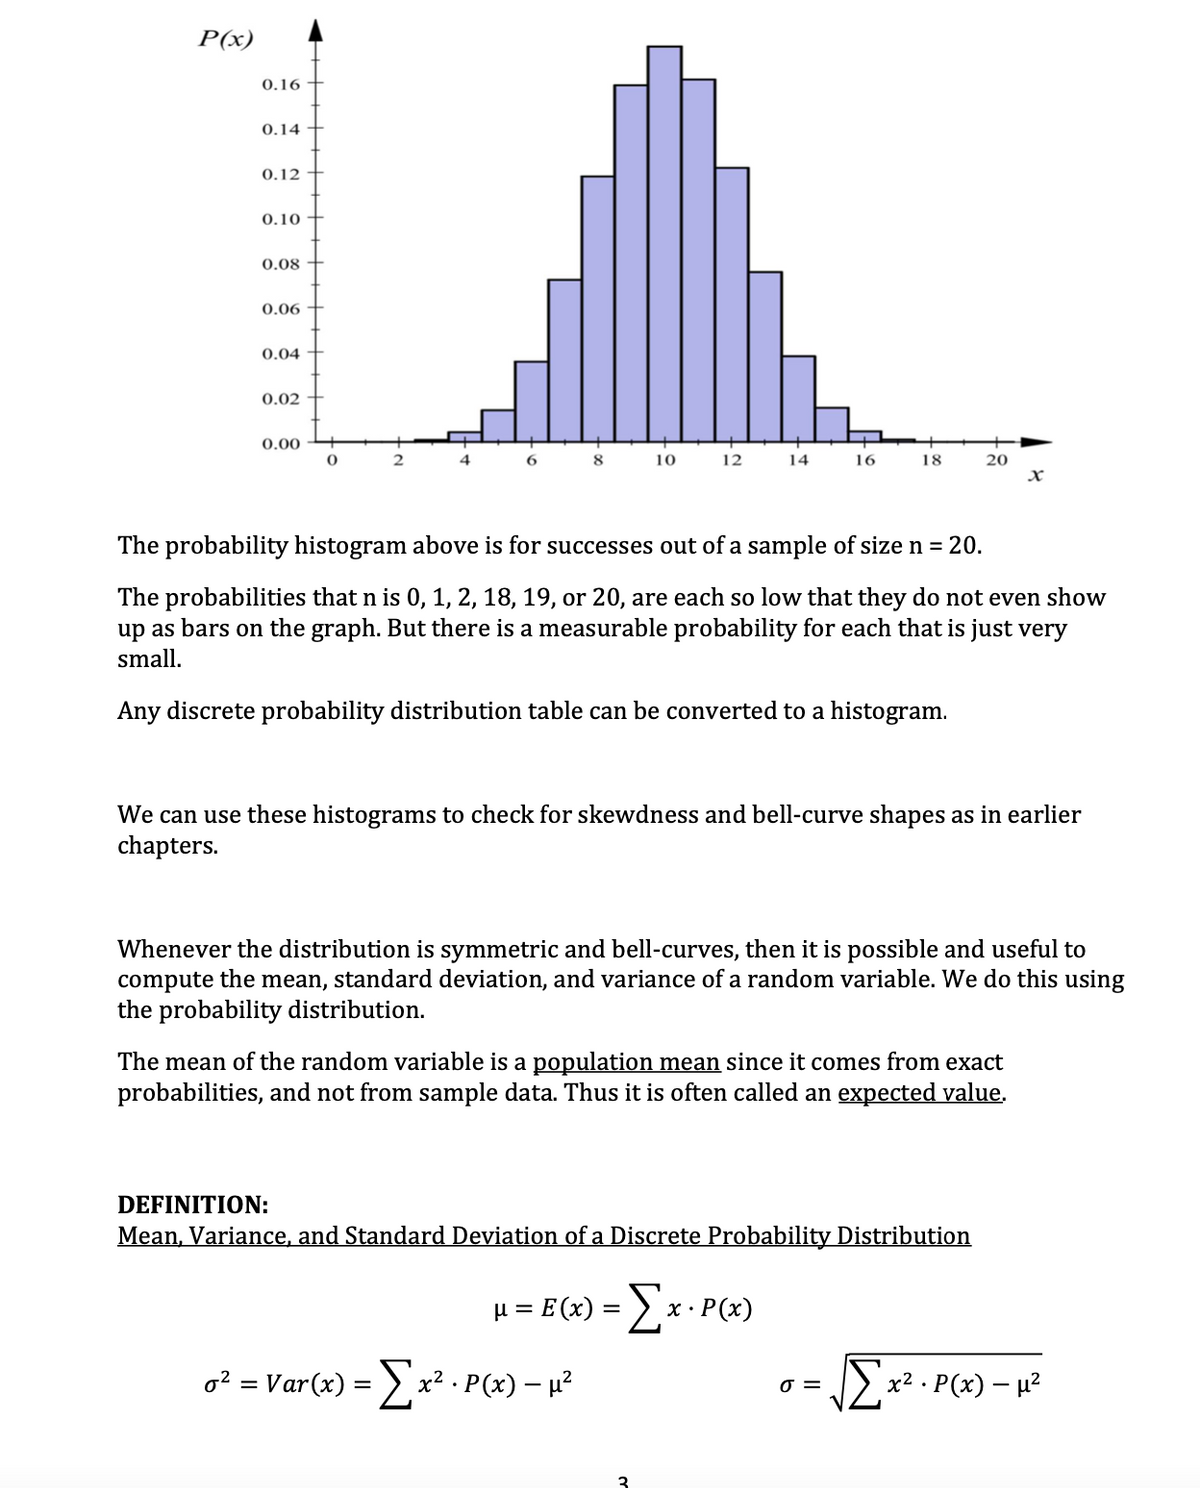
o² = Var(x) = Σ x² · P(x) − µ²
16
The probability histogram above is for successes out of a sample of size n = 20.
The probabilities that n is 0, 1, 2, 18, 19, or 20, are each so low that they do not even show
up as bars on the graph. But there is a measurable probability for each that is just very
small.
Any discrete probability distribution table can be converted to a histogram.
μ = E(x) = [x · P(x)
3
18
We can use these histograms to check for skewdness and bell-curve shapes as in earlier
chapters.
Whenever the distribution is symmetric and bell-curves, then it is possible and useful to
compute the mean, standard deviation, and variance of a random variable. We do this using
the probability distribution.
The mean of the random variable is a population mean since it comes from exact
probabilities, and not from sample data. Thus it is often called an expected value.
DEFINITION:
Mean, Variance, and Standard Deviation of a Discrete Probability Distribution
20
J =
x
√Σx²
x². P(x) - μ²

Transcribed Image Text:6. On page 3 of chapter 4 there is a discrete probability
histogram. On this graph, what are the exact values that count
as the edges for the discrete random variable x = 10?
O The bar is from 9.8 to 10.2
O The bar is from 9.5 to 10.5.
O The bar is from 10 to 11.
The bar is from 9 to 10.
Expert Solution
This question has been solved!
Explore an expertly crafted, step-by-step solution for a thorough understanding of key concepts.

This is a popular solution

Trending nowThis is a popular solution!

Step by stepSolved in 2 steps with 1 images

Knowledge Booster

Similar questions
arrow_back_ios
arrow_forward_ios
Recommended textbooks for you
- MATLAB: An Introduction with ApplicationsStatisticsISBN:9781119256830Author:Amos GilatPublisher:John Wiley & Sons Inc
 Probability and Statistics for Engineering and th...StatisticsISBN:9781305251809Author:Jay L. DevorePublisher:Cengage Learning
 Statistics for The Behavioral Sciences (MindTap C...StatisticsISBN:9781305504912Author:Frederick J Gravetter, Larry B. WallnauPublisher:Cengage Learning
  Elementary Statistics: Picturing the World (7th E...StatisticsISBN:9780134683416Author:Ron Larson, Betsy FarberPublisher:PEARSON
 The Basic Practice of StatisticsStatisticsISBN:9781319042578Author:David S. Moore, William I. Notz, Michael A. FlignerPublisher:W. H. Freeman
 Introduction to the Practice of StatisticsStatisticsISBN:9781319013387Author:David S. Moore, George P. McCabe, Bruce A. CraigPublisher:W. H. Freeman
MATLAB: An Introduction with Applications
Statistics
ISBN:9781119256830
Author:Amos Gilat
Publisher:John Wiley & Sons Inc
Probability and Statistics for Engineering and th...
Statistics
ISBN:9781305251809
Author:Jay L. Devore
Publisher:Cengage Learning
Statistics for The Behavioral Sciences (MindTap C...
Statistics
ISBN:9781305504912
Author:Frederick J Gravetter, Larry B. Wallnau
Publisher:Cengage Learning
Elementary Statistics: Picturing the World (7th E...
Statistics
ISBN:9780134683416
Author:Ron Larson, Betsy Farber
Publisher:PEARSON
The Basic Practice of Statistics
Statistics
ISBN:9781319042578
Author:David S. Moore, William I. Notz, Michael A. Fligner
Publisher:W. H. Freeman
Introduction to the Practice of Statistics
Statistics
ISBN:9781319013387
Author:David S. Moore, George P. McCabe, Bruce A. Craig
Publisher:W. H. Freeman