ENGR.ECONOMIC ANALYSIS
14th Edition
ISBN: 9780190931919
Author: NEWNAN
Publisher: Oxford University Press
expand_more
expand_more
format_list_bulleted
Question
TOPIC: Monetary policy and the problem of inflationary and recessionary gaps

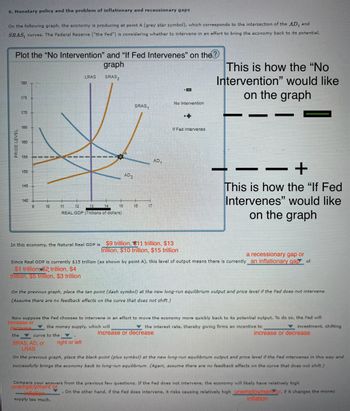
Transcribed Image Text:6. Monetary policy and the problem of inflationary and recessionary gaps
On the following graph, the economy is producing at point A (grey star symbol), which corresponds to the intersection of the AD, and
SRAS, curves. The Federal Reserve ("the Fed") is considering whether to intervene in an effort to bring the economy back to its potential.
Plot the "No Intervention" and "If Fed Intervenes" on the?
180
175
LRAS
graph
SRAS₂
This is how the "No
Intervention" would like
on the graph
PRICE LEVEL
170-
165
160
No Intervention
SRAS₁
A
155
AD₁
150
AD2
145
140
9
10
11
12
13
14
15
16
17
REAL GDP (Trillions of dollars)
++
If Fed Intervenes
This is how the "If Fed
Intervenes" would like
on the graph
In this economy, the Natural Real GDP is $9 trillion, 11 trillion, $13
trillion, $10 trillion, $15 trillion
a recessionary gap or
Since Real GDP is currently $15 trillion (as shown by point A), this level of output means there is currently an inflationary gap of
$1 trillion, $2 trillion, $4
trillion, $5 trillion, $3 trillion
On the previous graph, place the tan point (dash symbol) at the new long-run equilibrium output and price level if the Fed does not intervene.
(Assume there are no feedback effects on the curve that does not shift.)
Now suppose the Fed chooses to intervene in an effort to move the economy more quickly back to its potential output. To do so, the Fed will
increase or
decrease
the money supply, which will
the interest rate, thereby giving firms an incentive to
increase or decrease
investment, shifting
increase or decrease
the
curve to the
SRAS, AD, or
right or left
LRAS
On the previous graph, place the black point (plus symbol) at the new long-run equilibrium output and price level if the Fed intervenes in this way and
successfully brings the economy back to long-run equilibrium. (Again, assume there are no feedback effects on the curve that does not shift.)
Compare your answers from the previous few questions. If the Fed does not intervene, the economy will likely have relatively high
unemployment or
inflation
.
supply too much.
On the other hand, if the Fed does intervene, it risks causing relatively high unemploymen or, if it changes the money
inflation
Expert Solution
This question has been solved!
Explore an expertly crafted, step-by-step solution for a thorough understanding of key concepts.
Step by stepSolved in 2 steps

Knowledge Booster
Similar questions
- If “inflation is always and everywhere a monetary phenomenon,” why did the huge expansions of central bank money by the Federal Reserve, the ECB, and the Bank of Japan between 2007 and 2018 not result in high inflation in those economies? The previously answered questions have a range of 2007-2015. Note:- Do not provide handwritten solution. Maintain accuracy and quality in your answer. Take care of plagiarism. Answer completely. You will get up vote for sure.arrow_forwardIn order to manipulate the inflation rate in the United States, the Federal Reserve lowers the federal funds rate. What will occur as a result? Select all that apply.arrow_forwardSince the committee's meeting labor market conditions deteriorated and the available data indicate that consumer spending, business investment and industrial production have declined. Finiacial markets remain quite strained and credit conditions tight. identify the policy action is fiscal or monetary identify the policy is expansionary or contraction artarrow_forward
arrow_back_ios
arrow_forward_ios
Recommended textbooks for you

 Principles of Economics (12th Edition)EconomicsISBN:9780134078779Author:Karl E. Case, Ray C. Fair, Sharon E. OsterPublisher:PEARSON
 Engineering Economy (17th Edition)EconomicsISBN:9780134870069Author:William G. Sullivan, Elin M. Wicks, C. Patrick KoellingPublisher:PEARSON
 Principles of Economics (MindTap Course List)EconomicsISBN:9781305585126Author:N. Gregory MankiwPublisher:Cengage Learning
 Managerial Economics: A Problem Solving ApproachEconomicsISBN:9781337106665Author:Luke M. Froeb, Brian T. McCann, Michael R. Ward, Mike ShorPublisher:Cengage Learning
 Managerial Economics & Business Strategy (Mcgraw-...EconomicsISBN:9781259290619Author:Michael Baye, Jeff PrincePublisher:McGraw-Hill Education


Principles of Economics (12th Edition)
Economics
ISBN:9780134078779
Author:Karl E. Case, Ray C. Fair, Sharon E. Oster
Publisher:PEARSON

Engineering Economy (17th Edition)
Economics
ISBN:9780134870069
Author:William G. Sullivan, Elin M. Wicks, C. Patrick Koelling
Publisher:PEARSON

Principles of Economics (MindTap Course List)
Economics
ISBN:9781305585126
Author:N. Gregory Mankiw
Publisher:Cengage Learning

Managerial Economics: A Problem Solving Approach
Economics
ISBN:9781337106665
Author:Luke M. Froeb, Brian T. McCann, Michael R. Ward, Mike Shor
Publisher:Cengage Learning

Managerial Economics & Business Strategy (Mcgraw-...
Economics
ISBN:9781259290619
Author:Michael Baye, Jeff Prince
Publisher:McGraw-Hill Education