
MATLAB: An Introduction with Applications
6th Edition
ISBN: 9781119256830
Author: Amos Gilat
Publisher: John Wiley & Sons Inc
expand_more
expand_more
format_list_bulleted
Related questions
Concept explainers
Question
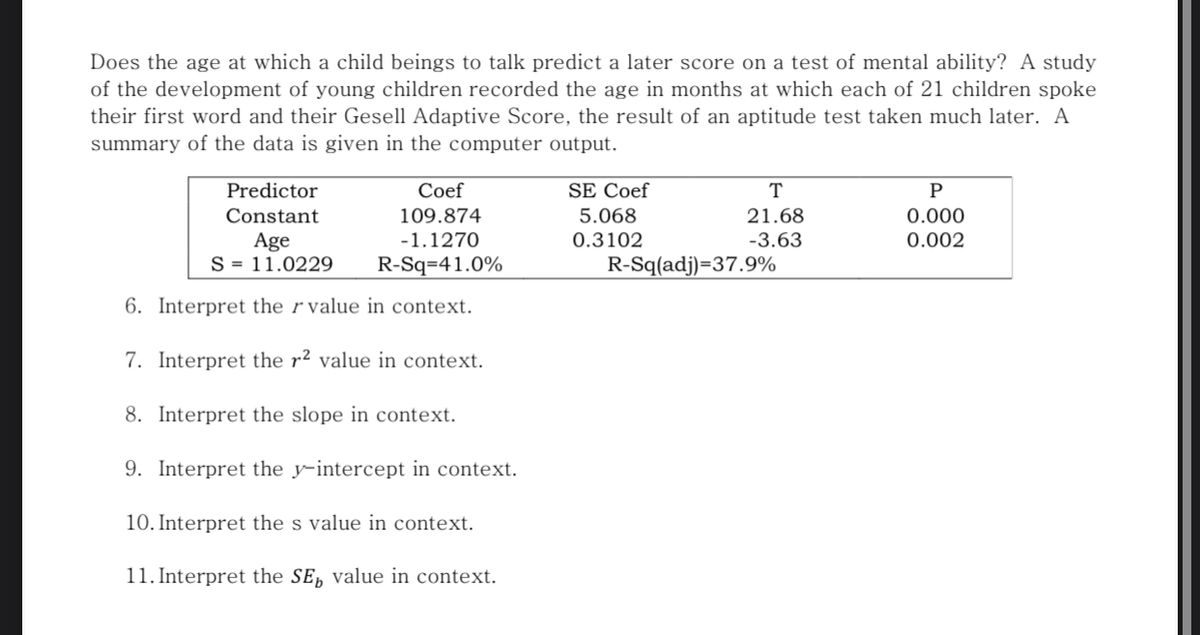

Transcribed Image Text:Does the age at which a child beings to talk predict a later score on a test of mental ability? A study
of the development of young children recorded the age in months at which each of 21 children spoke
their first word and their Gesell Adaptive Score, the result of an aptitude test taken much later. A
summary of the data is given in the computer output.
Predictor
Сoef
SE Coef
T
0.000
0.002
Constant
109.874
5.068
21.68
-1.1270
0.3102
-3.63
Age
S = 11.0229
R-Sq=41.0%
R-Sq(adj)=37.9%
6. Interpret the r value in context.
7. Interpret the r² value in context.
8. Interpret the slope in context.
9. Interpret the y-intercept in context.
10. Interpret the s value in context.
11. Interpret the SE, value in context.
Expert Solution
This question has been solved!
Explore an expertly crafted, step-by-step solution for a thorough understanding of key concepts.

This is a popular solution

Trending nowThis is a popular solution!

Step by stepSolved in 2 steps with 1 images

Knowledge Booster


Learn more about
Need a deep-dive on the concept behind this application? Look no further. Learn more about this topic, statistics and related others by exploring similar questions and additional content below.Similar questions
- 6. Which statement best describes the data in a scatter plot where the y-values are decreasing as the x-values are increasing? A The data can best be modeled by a vertical line. В The data can best be modeled by a horizontal line. The data can best be modeled by a line with a positive slope. D The data can best be modeled by a line with a negative slope.arrow_forwardThe percent of defects is the x-coordinate, while the percent of new machines is the y-coordinate. So, the table of values corresponds to the points (25,32), (20,40), (15,50), (10,65), (5,70), (0,85). Question Using the linear relationship graphed above, estimate the percent of new machines if there is 12% defects in the shoes at various production facilities. Provide your answer below: _____arrow_forwardChange the statement from standard form to slope-intercept form. Identify the slope and y-intercept.arrow_forward
Recommended textbooks for you
- MATLAB: An Introduction with ApplicationsStatisticsISBN:9781119256830Author:Amos GilatPublisher:John Wiley & Sons Inc
 Probability and Statistics for Engineering and th...StatisticsISBN:9781305251809Author:Jay L. DevorePublisher:Cengage Learning
 Statistics for The Behavioral Sciences (MindTap C...StatisticsISBN:9781305504912Author:Frederick J Gravetter, Larry B. WallnauPublisher:Cengage Learning
  Elementary Statistics: Picturing the World (7th E...StatisticsISBN:9780134683416Author:Ron Larson, Betsy FarberPublisher:PEARSON
 The Basic Practice of StatisticsStatisticsISBN:9781319042578Author:David S. Moore, William I. Notz, Michael A. FlignerPublisher:W. H. Freeman
 Introduction to the Practice of StatisticsStatisticsISBN:9781319013387Author:David S. Moore, George P. McCabe, Bruce A. CraigPublisher:W. H. Freeman
MATLAB: An Introduction with Applications
Statistics
ISBN:9781119256830
Author:Amos Gilat
Publisher:John Wiley & Sons Inc
Probability and Statistics for Engineering and th...
Statistics
ISBN:9781305251809
Author:Jay L. Devore
Publisher:Cengage Learning
Statistics for The Behavioral Sciences (MindTap C...
Statistics
ISBN:9781305504912
Author:Frederick J Gravetter, Larry B. Wallnau
Publisher:Cengage Learning
Elementary Statistics: Picturing the World (7th E...
Statistics
ISBN:9780134683416
Author:Ron Larson, Betsy Farber
Publisher:PEARSON
The Basic Practice of Statistics
Statistics
ISBN:9781319042578
Author:David S. Moore, William I. Notz, Michael A. Fligner
Publisher:W. H. Freeman
Introduction to the Practice of Statistics
Statistics
ISBN:9781319013387
Author:David S. Moore, George P. McCabe, Bruce A. Craig
Publisher:W. H. Freeman