
ENGR.ECONOMIC ANALYSIS
14th Edition
ISBN: 9780190931919
Author: NEWNAN
Publisher: Oxford University Press
expand_more
expand_more
format_list_bulleted
Related questions
Question
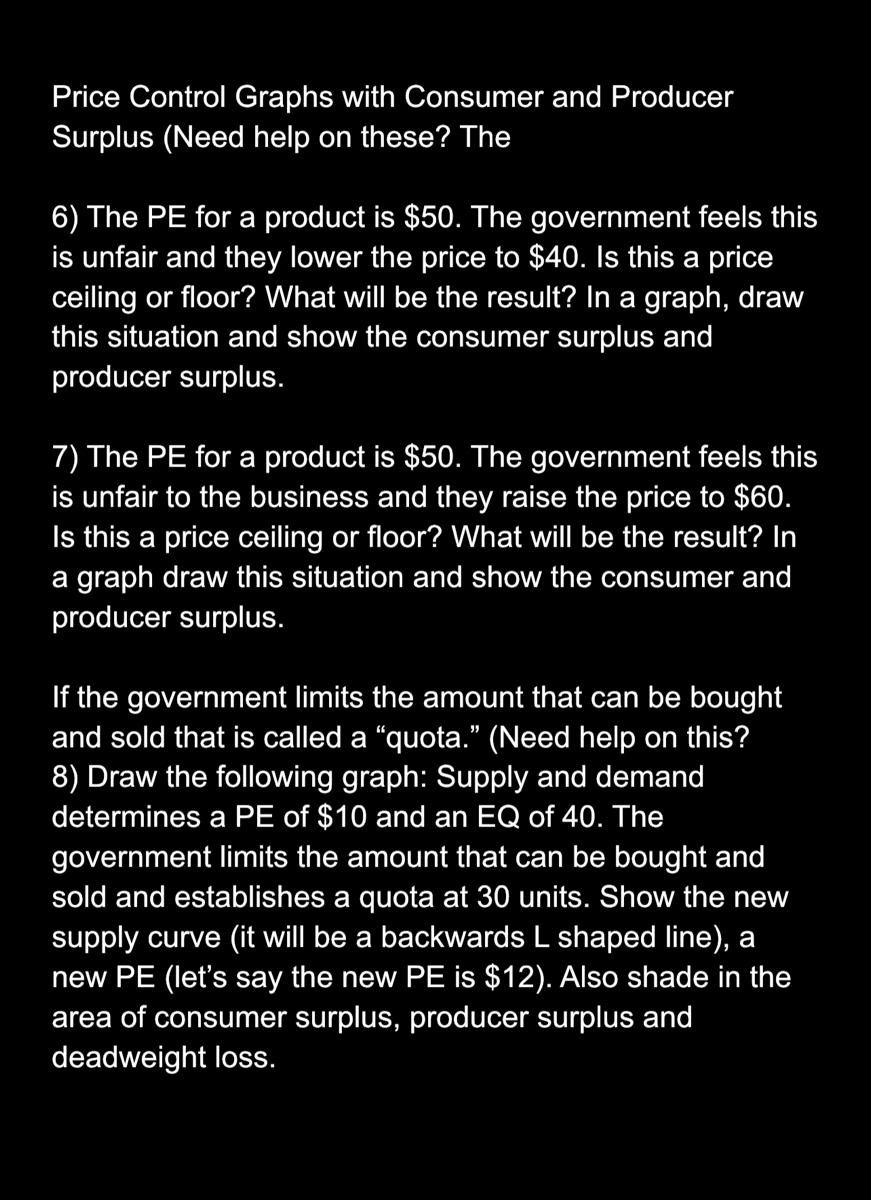

Transcribed Image Text:Price Control Graphs with Consumer and Producer
Surplus (Need help on these? The
6) The PE for a product is $50. The government feels this
is unfair and they lower the price to $40. Is this a price
ceiling or floor? What will be the result? In a graph, draw
this situation and show the consumer surplus and
producer surplus.
7) The PE for a product is $50. The government feels this
is unfair to the business and they raise the price to $60.
Is this a price ceiling or floor? What will be the result? In
a graph draw this situation and show the consumer and
producer surplus.
If the government limits the amount that can be bought
and sold that is called a "quota." (Need help on this?
8) Draw the following graph: Supply and demand
determines a PE of $10 and an EQ of 40. The
government limits the amount that can be bought and
sold and establishes a quota at 30 units. Show the new
supply curve (it will be a backwards L shaped line), a
new PE (let's say the new PE is $12). Also shade in the
area of consumer surplus, producer surplus and
deadweight loss.
Expert Solution
This question has been solved!
Explore an expertly crafted, step-by-step solution for a thorough understanding of key concepts.

Step by stepSolved in 2 steps with 1 images

Knowledge Booster


Learn more about
Need a deep-dive on the concept behind this application? Look no further. Learn more about this topic, economics and related others by exploring similar questions and additional content below.Similar questions
- Explain it correctly.arrow_forwardSubject: economicarrow_forwardanity 9. Refer to the diagrams posted with the problem set instructions. If the price ceiling is binding, determine: a. the area of consumer surplus. b. the area of producer surplus. e une area of consumer surplus in $$$. Carrow_forward
- For the subsidy in the last question ($1000 per month), what are: (a) the change in consumer surplus; (b) the change in producer surplus; (c) the government cost of the subsidy; and (d) the deadweight loss.arrow_forwardThe diagram to the right shows a market in which a price floor has been imposed. Calculate the following: 5.25 a. Consumer surplus with this price floor is $ Supply b. Producer surplus with this price floor is $ 4.25A. Proor c. The deadweight loss is 3.25 d. Compared to equilibrium, the transfer of consumer surplus to producers is $ E D. 2.25 Demand 1.25 35,000 70.000 Quantity Pricearrow_forwardDon't use chatgpt, I will 5 upvotes The diagram below shows the market for cheddar cheese. The government has imposed a price ceiling in the market at $2.4. Calculate the consumer surplusarrow_forward
- Relative to the equilibrium, who is made better off by a price ceiling that equals $2? A. Buyers B. Sellers C. Both buyers and sellers D. Neither E. None of the abovearrow_forwardA P1 P2 P3 Quantity (Figure: Gain in Consumer Surplus) Look at the figure Gain in Consumer Surplus. If the price is at P1. The government set a price ceiling at P3, identify the area or areas that represent the new total consumer surplus. O A and B O A and B and C O A and B and C and D OA O A and B and D F.arrow_forwardWhat does each part of the graph stand for? Assume that a local government imposes a price ceiling of $8, how many units will be excessively supplied/demanded?arrow_forward
arrow_back_ios
arrow_forward_ios
Recommended textbooks for you
 Principles of Economics (12th Edition)EconomicsISBN:9780134078779Author:Karl E. Case, Ray C. Fair, Sharon E. OsterPublisher:PEARSON
 Engineering Economy (17th Edition)EconomicsISBN:9780134870069Author:William G. Sullivan, Elin M. Wicks, C. Patrick KoellingPublisher:PEARSON
 Principles of Economics (MindTap Course List)EconomicsISBN:9781305585126Author:N. Gregory MankiwPublisher:Cengage Learning
 Managerial Economics: A Problem Solving ApproachEconomicsISBN:9781337106665Author:Luke M. Froeb, Brian T. McCann, Michael R. Ward, Mike ShorPublisher:Cengage Learning
 Managerial Economics & Business Strategy (Mcgraw-...EconomicsISBN:9781259290619Author:Michael Baye, Jeff PrincePublisher:McGraw-Hill Education
Principles of Economics (12th Edition)
Economics
ISBN:9780134078779
Author:Karl E. Case, Ray C. Fair, Sharon E. Oster
Publisher:PEARSON
Engineering Economy (17th Edition)
Economics
ISBN:9780134870069
Author:William G. Sullivan, Elin M. Wicks, C. Patrick Koelling
Publisher:PEARSON
Principles of Economics (MindTap Course List)
Economics
ISBN:9781305585126
Author:N. Gregory Mankiw
Publisher:Cengage Learning
Managerial Economics: A Problem Solving Approach
Economics
ISBN:9781337106665
Author:Luke M. Froeb, Brian T. McCann, Michael R. Ward, Mike Shor
Publisher:Cengage Learning
Managerial Economics & Business Strategy (Mcgraw-...
Economics
ISBN:9781259290619
Author:Michael Baye, Jeff Prince
Publisher:McGraw-Hill Education