
MATLAB: An Introduction with Applications
6th Edition
ISBN: 9781119256830
Author: Amos Gilat
Publisher: John Wiley & Sons Inc
expand_more
expand_more
format_list_bulleted
Related questions
Concept explainers
Topic Video
Question
Number 99 part A, B, and C
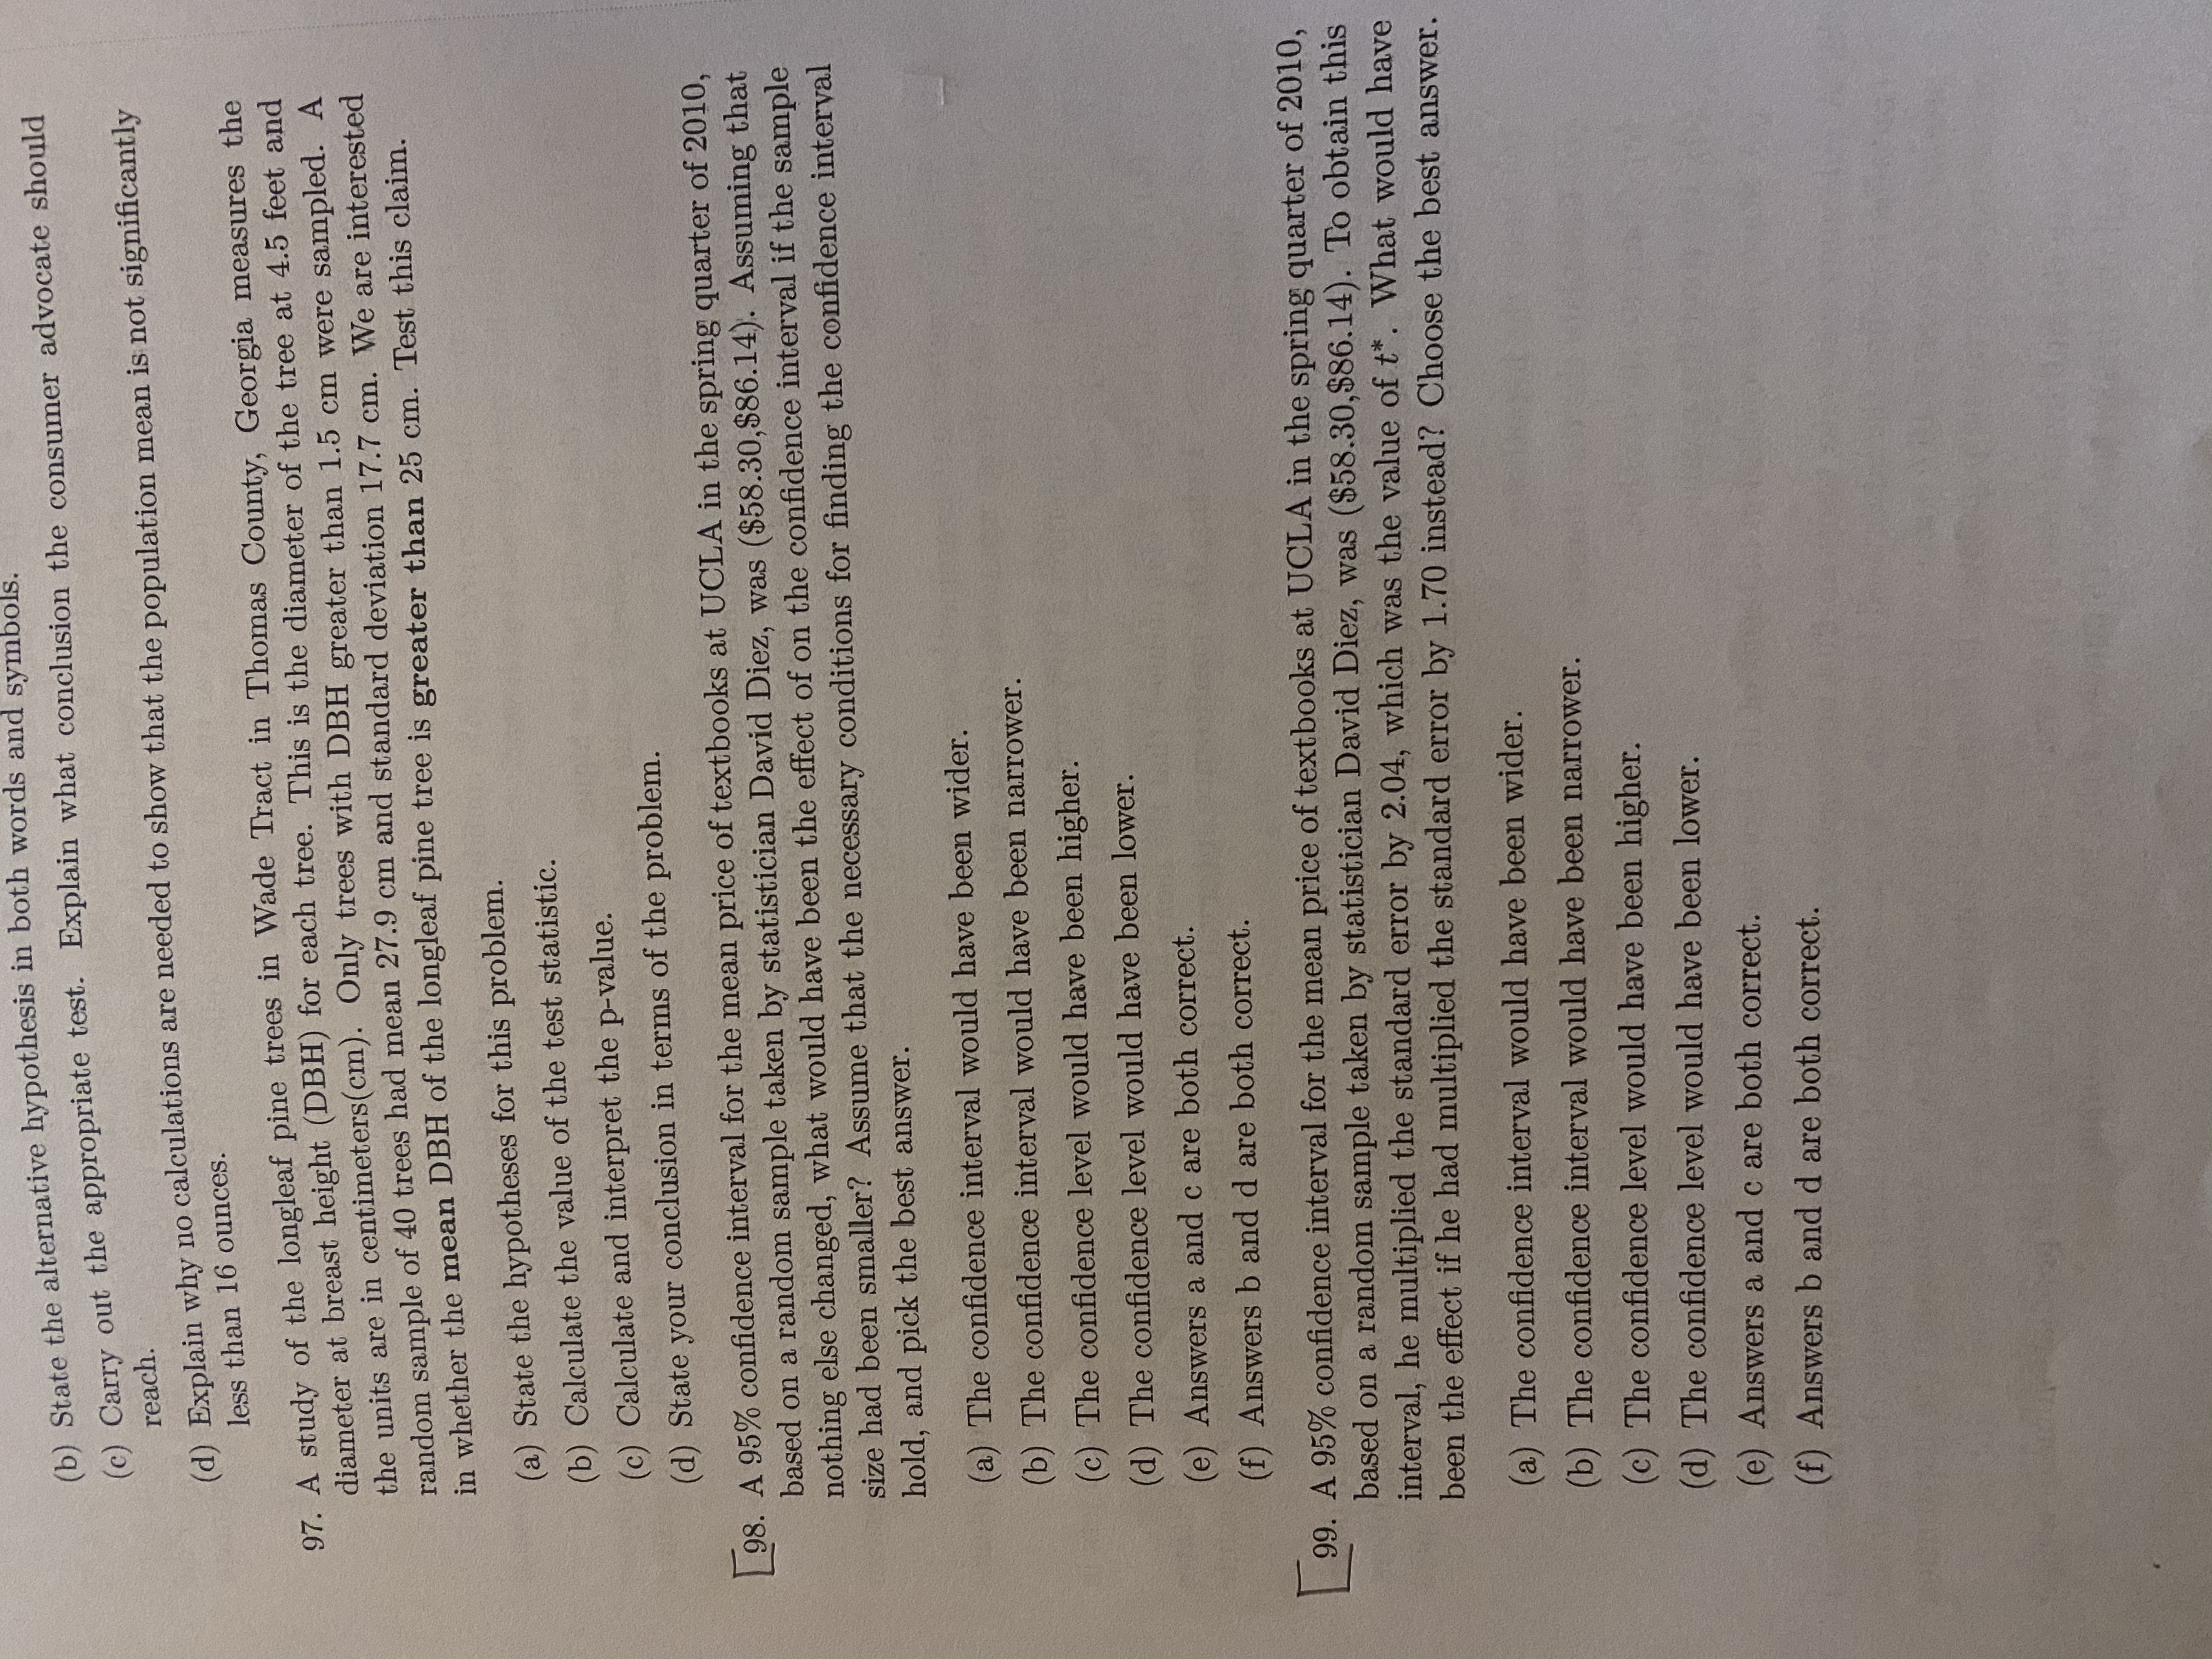

Transcribed Image Text:(6) State the alternative hypothesis in both words and symbols.
(c) Carry out the appropriate test. Explain what conclusion the consumer advocate should
reach.
(d) Explain why no calculations are needed to show that the population mean is not significantly
less than 16 ounces.
97. A study of the longleaf pine trees in Wade Tract in Thomas County, Georgia measures the
diameter at breast height (DBH) for each tree. This is the diameter of the tree at 4.5 feet and
the units are in centimeters(cm). Only trees with DBH greater than 1.5 cm were sampled. A
random sample of 40 trees had mean 27.9 cm and standard deviation 17.7 cm. We are interested
in whether the mean DBH of the longleaf pine tree is greater than 25 cm. Test this claim.
(a) State the hypotheses for this problem.
(b) Calculate the value of the test statistic.
(c) Calculate and interpret the p-value.
(d) State your conclusion in terms of the problem.
98. A 95% confidence interval for the mean price of textbooks at UCLA in the spring quarter of 2010,
based on a random sample taken by statistician David Diez, was ($58.30,$86.14). Assuming that
nothing else changed, what would have been the effect of on the confidence interval if the sample
size had been smaller? Assume that the necessary conditions for finding the confidence interval
hold, and pick the best answer.
(a) The confidence interval would have been wider.
(b) The confidence interval would have been narrower.
(c) The confidence level would have been higher.
(d) The confidence level would have been lower.
(e) Answers a and c are both correct.
(f) Answers b and d are both correct.
99. A 95% confidence interval for the mean price of textbooks at UCLA in the spring quarter of 2010,
based on a random sample taken by statistician David Diez, was ($58.30,$86.14). To obtain this
interval, he multiplied the standard error by 2.04, which was the value of t*. What would have
been the effect if he had multiplied the standard error by 1.70 instead? Choose the best answer.
(a) The confidence interval would have been wider.
(b) The confidence interval would have been narrower.
(c) The confidence level would have been higher.
(d) The confidence level would have been lower.
(e) Answers a and c are both correct.
(f) Answers b and d are both correct.
Expert Solution
This question has been solved!
Explore an expertly crafted, step-by-step solution for a thorough understanding of key concepts.

This is a popular solution

Trending nowThis is a popular solution!

Step by stepSolved in 2 steps with 1 images

Knowledge Booster


Learn more about
Need a deep-dive on the concept behind this application? Look no further. Learn more about this topic, statistics and related others by exploring similar questions and additional content below.Similar questions
- What is the probability of drawing a BLACK card OR a card with a LETTER?arrow_forwardM.20 13arrow_forwardUsing the region names in the image below, select all regions that represent: An B'n C -B II VIII V IV VI VII A intersection not B intersection C. Region I: Items only in group A, not in B or C. Region II: Items in A and B, but not C. Region IlI: Items only in B, not in A or C. Region IV: Items in A and C, but not B. Region V: Items in A, B, and C. Region VI: Items in B and C, but not A. Region VIl: Items only in C, not in A or B. Region VIII: Items not in any of the groups.arrow_forward
arrow_back_ios
arrow_forward_ios
Recommended textbooks for you
- MATLAB: An Introduction with ApplicationsStatisticsISBN:9781119256830Author:Amos GilatPublisher:John Wiley & Sons Inc
 Probability and Statistics for Engineering and th...StatisticsISBN:9781305251809Author:Jay L. DevorePublisher:Cengage Learning
 Statistics for The Behavioral Sciences (MindTap C...StatisticsISBN:9781305504912Author:Frederick J Gravetter, Larry B. WallnauPublisher:Cengage Learning
  Elementary Statistics: Picturing the World (7th E...StatisticsISBN:9780134683416Author:Ron Larson, Betsy FarberPublisher:PEARSON
 The Basic Practice of StatisticsStatisticsISBN:9781319042578Author:David S. Moore, William I. Notz, Michael A. FlignerPublisher:W. H. Freeman
 Introduction to the Practice of StatisticsStatisticsISBN:9781319013387Author:David S. Moore, George P. McCabe, Bruce A. CraigPublisher:W. H. Freeman
MATLAB: An Introduction with Applications
Statistics
ISBN:9781119256830
Author:Amos Gilat
Publisher:John Wiley & Sons Inc
Probability and Statistics for Engineering and th...
Statistics
ISBN:9781305251809
Author:Jay L. Devore
Publisher:Cengage Learning
Statistics for The Behavioral Sciences (MindTap C...
Statistics
ISBN:9781305504912
Author:Frederick J Gravetter, Larry B. Wallnau
Publisher:Cengage Learning
Elementary Statistics: Picturing the World (7th E...
Statistics
ISBN:9780134683416
Author:Ron Larson, Betsy Farber
Publisher:PEARSON
The Basic Practice of Statistics
Statistics
ISBN:9781319042578
Author:David S. Moore, William I. Notz, Michael A. Fligner
Publisher:W. H. Freeman
Introduction to the Practice of Statistics
Statistics
ISBN:9781319013387
Author:David S. Moore, George P. McCabe, Bruce A. Craig
Publisher:W. H. Freeman