
FINANCIAL ACCOUNTING
10th Edition
ISBN: 9781259964947
Author: Libby
Publisher: MCG
expand_more
expand_more
format_list_bulleted
Related questions
Question
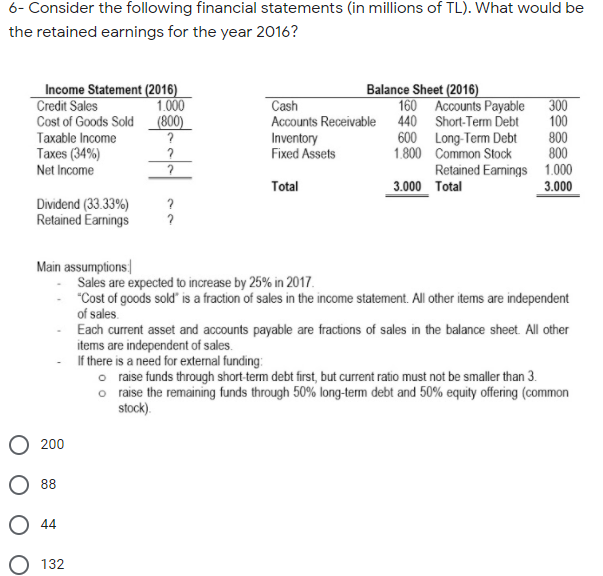

Transcribed Image Text:6- Consider the following financial statements (in millions of TL). What would be
the retained earnings for the year 2016?
Balance Sheet (2016)
Income Statement (2016)
Credit Sales
Cost of Goods Sold (800)
Taxable Income
1.000
Cash
160 Accounts Payable
Accounts Receivable 440 Short-Term Debt
600 Long-Term Debt
1.800 Common Stock
300
100
800
800
Retained Earnings 1.000
3.000
Inventory
Fixed Assets
Taxes (34%)
Net Income
Total
3.000 Total
Dividend (33.33%)
Retained Earnings
Main assumptions
Sales are expected to increase by 25% in 2017.
"Cost of goods sold" is a fraction of sales in the income statement. All other items are independent
of sales.
Each current asset and accounts payable are fractions of sales in the balance sheet. All other
items are independent of sales.
If there is a need for external funding:
o raise funds through short term debt first, but current ratio must not be smaller than 3.
o raise the remaining funds through 50% long-term debt and 50% equity offering (common
stock).
200
88
44
132
Expert Solution
This question has been solved!
Explore an expertly crafted, step-by-step solution for a thorough understanding of key concepts.

Step by stepSolved in 3 steps

Knowledge Booster


Learn more about
Need a deep-dive on the concept behind this application? Look no further. Learn more about this topic, accounting and related others by exploring similar questions and additional content below.Similar questions
- Use the following information to answer this question. Windswept, Incorporated 2022 Income Statement (in millions) Het sales Cost of goods sold Depreciation Earnings before interest and taxes Interest paid Taxable income Taxes Net income Cash Accounts receivable Inventory Total Net fixed assets Total assets 2021 What is the equity multiplier for 20227 $11,100 8,050 430 $ 2,620 104 $2,516 881 $ 1,635 Windswept, 2921 and 2022 Balance Sheets. (in millions) 2022 $300 1,150 1,050 2,060 1,775 $ 3,510 $3,155 3,520 4,120 $7,030 $7,275 $ 330 porated Accounts payable Long-term debt Common stock Retained earnings Total liabilities & equity 2021 $1,870 1,090 3,400 670 2022 $1,932 1,373 3,050 920 $7,030 $7,275.arrow_forwardWant answer with calculationarrow_forwardBruno Inc.'s Financial Statement for years 2014-2015. Compute for the Bruno Inc. Year 2015 Debt to Equity Ratio. (Answer Format: 12.23%, if computed answer is 12.343% answer should be 12.34%, if computed answer is 12.347% answer should be 12.35%) INCOME STATEMENTS 2014 2015 BALANCE SHEETS Assets Cash 2014 2015 Net sales $ 4,760 $ 5,000 S 60 50 COGS (excl. depr.) 3,560 3,800 ST Investments 40 . Depreciation 170 200 Accounts receivable 380 500 480 500 Inventories 820 1,000 Other operating expenses EBIT S 550 S 500 Total CA $ 1,300 $ 1,550 Interest expense 100 120 Net PP&E 1,700 2,000 Pre-tax earnings S 450 S 380 $ 3,000 $ 3,550 Taxes (40%) 180 152 NI before pref. div. $ 270 228 Preferred div. 8 8 S 190 $ 200 Net income $ 262 220 280 300 130 280 Other Data $ 600 S 780 Common dividends $48 $50 1,000 1,200 Addition to RE $214 $170 $ 1,600 $ 1,980 Tax rate 40% 40% 100 100 Shares of common stock 50 50 500 500 Earnings per share $5.24 $4.40 800 970 Dividends per share $0.96 $1.00 $ 1,300 S…arrow_forward
- Flounder Company has been operating for several years, and on December 31, 2017, presented the following balance sheet. FLOUNDER COMPANY BALANCE SHEET DECEMBER 31, 2017 Cash $20,900 Accounts payable $80,000 Receivables 117,000 Long-term notes payable 181,000 Inventory 75,000 Common stock (no par) 110,000 Plant assets (net) 354,000 Retained earnings 195,900 $566,900 $566,900 The net income for 2017 was $43,000. Assume that total assets are the same in 2016 and 2017.arrow_forwardHow do I calculate based on the Income Statement and Balance sheet below: Times Interest Earned =Earnings before interest & taxes/interest expense, gross? (in thousands) (in thousands) 2015 2014 Sales (net) 30,500 Cash 400 500 Interest income 500 Short-term investments 300 200 Total Revenue 31,000 Accounts receivable (net) 3,200 2,900 Cost and expenses Inventory 6,000 5,400 Cost of goods sold 17,600 Total current assets 9,900 9,000 Selling and general administrative expenses 3,550 Property, plant, and equipment 7,100 7,000 Depreciation and amortization expenses 1,890 Total assets 17,000 16,000 Interest Expense 900 Accounts payable 3,700 3,400 Total costs and expenses 23,940 Income taxes payable 900 800 Income before taxes 7,060 Accrued expenses 1,700 1,400 Income taxes -2,800 Total current liabilities 6,300 5,600 Net income 4,260 Long-term debt 2,000 1,800 Total liabilities 8,300 7,400 Common…arrow_forwardBruno Inc.'s Financial Statement for years 2014-2015. Compute for the Bruno Inc. Year 2015 Debt to Equity Ratio. (Answer Format: 12.23%, if computed answer is 12.343% answer should be 12.34%, if computed answer is 12.347% answer should be 12.35%)arrow_forward
- 64.) Using Financial Statements for 2018-2019. Net book value for 2019 is $8,394,200. TRUE OR FALSE?arrow_forwardThe following data concern Tech Corporation for the 2022 financial year. Credit sales during the year $2 400 000 Accounts receivable 30 June 2022 410 000 Allowance for bad debts 30 June 2022 55 000 Bad debt expense for the year 70 000 What amount will Tech Corporation show on its year-end balance sheet for the net realisable value of its accounts receivable? a. 410 000 b. $285 000 c. $340 000 d. $ 355 000arrow_forward2.The Moon Company had net income in 2022 of AED 40 million. Here are some of the financial ratios from the annual report. Return on Assets = 5% Debt Assets Ratio = 55% Profit Margin = 4.5% Inventory in days = 20 days Using these ratios, calculate the following for the Remal Company: a) Salesb) Total assetsc) Total asset turnover d) Total debte) Stockholders' equity f) Return on equityg) Inventoryarrow_forward
- All the figures are in millions. Please calculate: debt ratio and times interest earned ratio Please written down the formulas used and use excel. BKW Current Asset Current Liabilities Total Liabilities Total Assets 2016 344,168 145,498 678,726 2,517,211 2017 356,979 160,215 752,063 2,719,903 2018 368,473 177,655 804,059 2,875,137 2019 495,024 261,798 925,626 3,092,984 2020 637,416 232,882 1,428,922 3,832,933 2021 579,863 268,282 1,546,085 4,025,832 BKW Net Cash Provided by operating activities Operating Income Before Tax Finance Costs Cash and cash eqiv & Accounts receivables 2016 148,507 121,756 - 14,080 19,641 + 133,225 2017 115,422 256,583 - 12,436 19,641 + 133,225 2018 170,948 244,453 - 14,456 21,167 + 122,216 2019 123,080 314,475 - 23,883 74,881 + 133,319 2020 75,259 417,117 -…arrow_forwardAll the figures are in millions Please write down the formulas used to answer the question and use excel to answer. Calculate: debt ratio and times interest earned ratio. LLC Current Asset Current Liabilities Total Liabilities Total Assets 2016 5,857.9 8,824.3 12,978.2 18,592.9 2017 6,261.3 10,757.7 14,687.7 20,854.2 2018 6,314.2 6,588.0 10,549.4 16,963.6 2019 5,756 6,287 10,821 17,178 2020 5,977 5,653 10,816 17,748 2021 4,950 5,983 10,049 17,000 BKW Net Cash Provided by operating activities Operating Income Before Tax Finance Costs Cash and cash eqiv & Accounts receivables 2016 853.0 862.8 - 126.2 1,008.4 + 2,785.0 2017 146.0 1,007.0 - 108. 6 1,249.2 + 2,749.2 2018 72.8 1,066.2 - 88.0 1,177.1 + 2,670.2 2019 60 620 - 142 1,290 + 2,050 2020 137 - 536 - 165 1, 1 1 1 + 1,667 2021 468 295 - 146 1,662 +…arrow_forwardThe current ratio for the following is ..... Group of answer choices .43 .23 .73 .53arrow_forward
arrow_back_ios
SEE MORE QUESTIONS
arrow_forward_ios
Recommended textbooks for you
 AccountingAccountingISBN:9781337272094Author:WARREN, Carl S., Reeve, James M., Duchac, Jonathan E.Publisher:Cengage Learning,
 Accounting Information SystemsAccountingISBN:9781337619202Author:Hall, James A.Publisher:Cengage Learning,
 Horngren's Cost Accounting: A Managerial Emphasis...AccountingISBN:9780134475585Author:Srikant M. Datar, Madhav V. RajanPublisher:PEARSON
 Intermediate AccountingAccountingISBN:9781259722660Author:J. David Spiceland, Mark W. Nelson, Wayne M ThomasPublisher:McGraw-Hill Education
 Financial and Managerial AccountingAccountingISBN:9781259726705Author:John J Wild, Ken W. Shaw, Barbara Chiappetta Fundamental Accounting PrinciplesPublisher:McGraw-Hill Education
Accounting
Accounting
ISBN:9781337272094
Author:WARREN, Carl S., Reeve, James M., Duchac, Jonathan E.
Publisher:Cengage Learning,
Accounting Information Systems
Accounting
ISBN:9781337619202
Author:Hall, James A.
Publisher:Cengage Learning,
Horngren's Cost Accounting: A Managerial Emphasis...
Accounting
ISBN:9780134475585
Author:Srikant M. Datar, Madhav V. Rajan
Publisher:PEARSON
Intermediate Accounting
Accounting
ISBN:9781259722660
Author:J. David Spiceland, Mark W. Nelson, Wayne M Thomas
Publisher:McGraw-Hill Education
Financial and Managerial Accounting
Accounting
ISBN:9781259726705
Author:John J Wild, Ken W. Shaw, Barbara Chiappetta Fundamental Accounting Principles
Publisher:McGraw-Hill Education