
Big Ideas Math A Bridge To Success Algebra 1: Student Edition 2015
1st Edition
ISBN: 9781680331141
Author: HOUGHTON MIFFLIN HARCOURT
Publisher: Houghton Mifflin Harcourt
expand_more
expand_more
format_list_bulleted
Related questions
Question
thumb_up100%
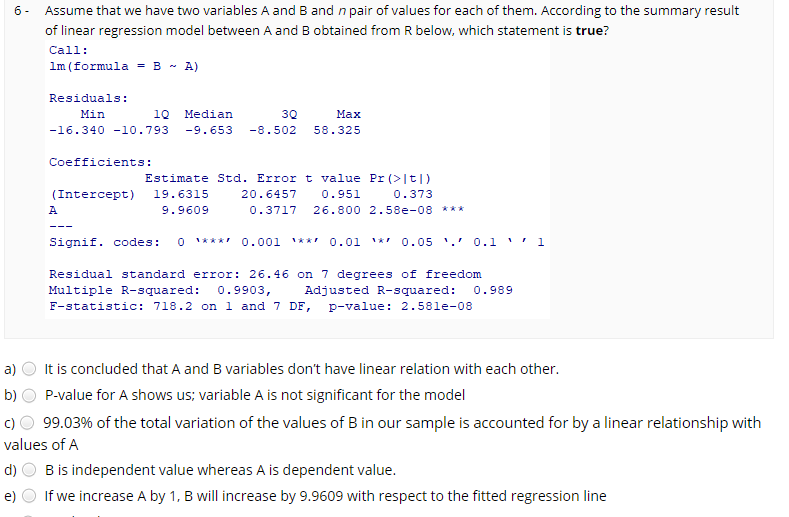

Transcribed Image Text:6- Assume that we have two variables A and B and n pair of values for each of them. According to the summary result
of linear regression model between A and B obtained from R below, which statement is true?
Call:
Im (formula = B -
A)
Residuals:
Min
10
Median
30
Маx
-16.340 -10.793
-9.653
-8.502
58.325
Coefficients:
Estimate std. Error t value Pr (>|t|)
(Intercept)
19.6315
20.6457
0.951
0.373
A
9.9609
0.3717
26.800 2.58e-08 ***
---
Signif. codes:
O **** 0.001
1** 0.01
1** 0.05 '.' 0.1 '' 1
Residual standard error: 26.46 on 7 degrees of freedom
Multiple R-squared:
0.9903,
Adjusted R-squared:
0.989
F-statistic: 718.2 on 1 and 7 DF,
p-value: 2.58le-08
a)
It is concluded that A and B variables don't have linear relation with each other.
b)
P-value for A shows us; variable A is not significant for the model
c)
99.03% of the total variation of the values of B in our sample is accounted for by a linear relationship with
values of A
B is independent value whereas A is dependent value.
If we increase A by 1, B will increase by 9.9609 with respect to the fitted regression line
d)
e)
Expert Solution
This question has been solved!
Explore an expertly crafted, step-by-step solution for a thorough understanding of key concepts.

This is a popular solution

Trending nowThis is a popular solution!

Step by stepSolved in 2 steps

Knowledge Booster

Similar questions
- Olympic Pole Vault The graph in Figure 7 indicates that in recent years the winning Olympic men’s pole vault height has fallen below the value predicted by the regression line in Example 2. This might have occurred because when the pole vault was a new event there was much room for improvement in vaulters’ performances, whereas now even the best training can produce only incremental advances. Let’s see whether concentrating on more recent results gives a better predictor of future records. (a) Use the data in Table 2 (page 176) to complete the table of winning pole vault heights shown in the margin. (Note that we are using x=0 to correspond to the year 1972, where this restricted data set begins.) (b) Find the regression line for the data in part ‚(a). (c) Plot the data and the regression line on the same axes. Does the regression line seem to provide a good model for the data? (d) What does the regression line predict as the winning pole vault height for the 2012 Olympics? Compare this predicted value to the actual 2012 winning height of 5.97 m, as described on page 177. Has this new regression line provided a better prediction than the line in Example 2?arrow_forwardThe United States gross national product, in trillions of dollars, is given in the table below. Date Gross national product 15.0 2010 2011 15.5 16.2 |2012 | 2013 16.7 (a) Find the equation of the regression line. (Let t be the number of years since 2010. Round regression line parameters to two decimal places.) Gt) = Explain the me aning of its slope. The slope of the line tells us that each year the gross national product increases by trillion dollars. (b) Plot the data points and the regression line. G 17 17 16 16 15 15 14 14 13 13 12 12 1 2 3 1 2 3 G G 17 17 16 16 15 15 14 14 13- 13 12 12 1 2 3 1 2 3 (c) When would you predict that a gross national product of 17.3 trillion dollars would be reached? (Round your answer to two decimal places.) The actual gross national product in 2014 was 17.3 trillion dollars. What does that say about your prediction? • This prediction is accurate. O This prediction is not accurate.arrow_forwardUse RStudio to fit a simple linear regression model to the data below. Please submit a copy of your code and any appropriate output (a photo/screenshot will be sufficient). 300? Is the fitted linear regression model What is the 95% prediction interval for xo = appropriate for this data, and which assumption appears to be violated if not? dataset <- data.frame ( с (294, 247, 267, 358, 423, 311, 450, 534, 438, 688, 630, 709, 627, 1021, 615, 700, 999, 1250, 1015, 850, 980, 1650, 1025, 1200, 1500), у 3 с (30, 32, 37, 44, 47, 49, 56, 62, 68, 80, 84, 88, 97, 97, 100, 106, 109, 112, 117, 128, 130, 135, 160, 180, 210) X = %3Darrow_forward
- The age and height (in cm) of 400 adult women from Bolivia were measured. A researcher wants to know if age has any effect on height. A linear regression is carried out in Minitab and the following output obtained. Coefficients Term Constant Age (a) Write down the regression model. (b) Interpret the regression coefficient for the fitted model. (c) Use the output from Minitab to explain if the age of a participant affects their height. Percent (d) The normal probability plot of the residuals from this regression model is given below. Do the assumptions of the regression model seem reasonable? Justify your answer. 99.9 8 28 22299229 88 Coef SE Coef 152.94 7.69 0.022 0.231 01 -100 T-Value P-Value VIF 19.90 0.000 0.10 0.924 1.00 -50 Normal Probability Plot (response is Height) 0 Residual 50 ***** 100 150arrow_forwardA trucking company considered a multiple regression model for relating the dependent variable y = total daily travel time for one of its drivers (hours) to the predictors x, = distance traveled (miles) and x, = the number of deliveries made. Suppose that the model equation is Y = -0.800 + 0.060x, + 0.900x2 + € (a) What is the mean value of travel time when distance traveled is 50 miles and four deliveries are made? 5.8 v hr (b) How would you interpret ß1 = 0.060, the coefficient of the predictor X1? o When the number of deliveries is held fixed, the average change in travel time associated with a one-mile (i.e. one unit) increase in distance traveled is 0.060 hours. O The total daily travel time increases by 0.060 hours when the distance traveled increases by 1. O When the number of deliveries is constant, the average change in travel time associated with a ten-mile (i.e. one unit) increase in distance traveled is 0.060 hours. O The average change in travel time associated with a…arrow_forwardThe table below shows the amounts of crude oil (in thousands of barrels per day) produced by a country and the amounts of crude oil (in thousands of barrels per day) imported by a country, for the last seven years. Construct and interpret a 95% prediction interval for the amount of crude oil imported by the this country when the amount of crude oil produced by the country is 5,509 thousand barrels per day. The equation of the regression line is ModifyingAbove .y=−1.137x+15,912.199. Oil produced, x 5,830 5,704 5,645 5,405 5,159 5,053 5,028 Oil imported, y 9,300 9,117 9,628 10,062 10,119 10,159 10,013 Construct and interpret a 95% prediction interval for the amount of crude oil imported when the amount of crude oil produced by the country is 5,509 thousand barrels per day. Select the correct choice below and fill in the answer boxes to complete your choice. (Round to the nearest cent as needed.) A. We can be 95% confident…arrow_forward
- Decide if gender of the students has a significant influence on the relationship between exam 2 and final results. Assume that the intercepts of the models for males and females are the same. Do not test for equality of intercepts. Are the slopes of the relationships between final and exam2 scores difference for males and females? Test on 10% significance. Include complex and simple model, hypotheses, test statistic, pvalue, and final regression equations for men and womenarrow_forwardSelect all the charts that violate the conditions for linear regression. These are residual plots so the red line represents the average residual, zero. 미 Od (a) (d) 매 Get help: Video (b) (e) (c) (1)arrow_forwardA study was done to look at the relationship between number of lovers college students have had in their lifetimes and their GPAs. The results of the survey are shown below. Lovers 2 6 4 8 4 4 5 4 GPA 3.4 1.3 2.7 0.9 2.7 2.3 2.6 1.9 The equation of the linear regression line is: ˆyy^ = + xx (Please show your answers to two decimal places) Use the model to predict the GPA of a college student who as had 5 lovers.GPA = (Please round your answer to one decimal place.)arrow_forward
- Compute the least-square regression line for predicting the president's age from the first lady's age. Round the slope and -intercept values to at least four decimal places.arrow_forwardCOmpare and constrast the use of prediction intervals for a Single Linear Regression model having one X and Multiple Linear Regression Model having two predictors X1 and X2. WHat are the similarities/differences in process and interpretation?arrow_forwardA study was done to look at the relationship between number of movies people watch at the theater each year and the number of books that they read each year. The results of the survey are shown below. Movies 8 5 4 6 4 7 9 6 10 Books 0 2 7 0 7 0 0 0 0 The p-value is: Incorrect Round to 4 decimal places. r2r2 = Incorrect (Round to two decimal places) The equation of the linear regression line is: ˆyy^ = Correct + Incorrect xx (Please show your answers to two decimal places) Use the model to predict the number of books read per year for someone who watches 6 movies per year.Books per year = Incorrect (Please round your answer to the nearest whole number.) Interpret the slope of the regression line in the context of the question: For every additional movie that people watch each year, there tends to be an average decrease of 1.07 books read. The slope has no practical meaning since people cannot read a negative number of books. As x goes up, y goes down.…arrow_forward
arrow_back_ios
SEE MORE QUESTIONS
arrow_forward_ios
Recommended textbooks for you
- Big Ideas Math A Bridge To Success Algebra 1: Stu...AlgebraISBN:9781680331141Author:HOUGHTON MIFFLIN HARCOURTPublisher:Houghton Mifflin Harcourt
 Algebra & Trigonometry with Analytic GeometryAlgebraISBN:9781133382119Author:SwokowskiPublisher:Cengage
 College AlgebraAlgebraISBN:9781305115545Author:James Stewart, Lothar Redlin, Saleem WatsonPublisher:Cengage Learning
  Algebra and Trigonometry (MindTap Course List)AlgebraISBN:9781305071742Author:James Stewart, Lothar Redlin, Saleem WatsonPublisher:Cengage Learning
 Glencoe Algebra 1, Student Edition, 9780079039897...AlgebraISBN:9780079039897Author:CarterPublisher:McGraw Hill
Big Ideas Math A Bridge To Success Algebra 1: Stu...
Algebra
ISBN:9781680331141
Author:HOUGHTON MIFFLIN HARCOURT
Publisher:Houghton Mifflin Harcourt
Algebra & Trigonometry with Analytic Geometry
Algebra
ISBN:9781133382119
Author:Swokowski
Publisher:Cengage
College Algebra
Algebra
ISBN:9781305115545
Author:James Stewart, Lothar Redlin, Saleem Watson
Publisher:Cengage Learning
Algebra and Trigonometry (MindTap Course List)
Algebra
ISBN:9781305071742
Author:James Stewart, Lothar Redlin, Saleem Watson
Publisher:Cengage Learning
Glencoe Algebra 1, Student Edition, 9780079039897...
Algebra
ISBN:9780079039897
Author:Carter
Publisher:McGraw Hill