MATLAB: An Introduction with Applications
6th Edition
ISBN: 9781119256830
Author: Amos Gilat
Publisher: John Wiley & Sons Inc
expand_more
expand_more
format_list_bulleted
Question


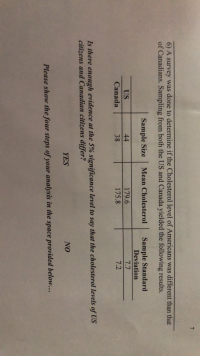
Transcribed Image Text:6) A survey was done to determine if the Cholesterol level of Americans was different than that
of Canadians. Sampling from both the US and Canada yielded the following results.
Sample Standard
Deviation
Sample Size
Mean Cholesterol
US
44
179.6
7.7
Canada
38
175.8
7.2
Is there enough evidence at the 5% significance level to say that the cholesterol levels of US
citizens and Canadian citizens differ?
YES
NO
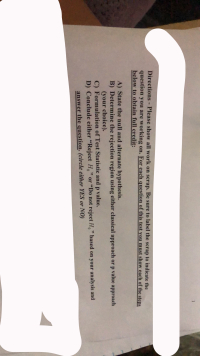
Please show the four steps of your analysis in the space provided below...
Expert Solution
This question has been solved!
Explore an expertly crafted, step-by-step solution for a thorough understanding of key concepts.
This is a popular solution
Trending nowThis is a popular solution!
Step by stepSolved in 2 steps with 3 images

Knowledge Booster
Learn more about
Need a deep-dive on the concept behind this application? Look no further. Learn more about this topic, statistics and related others by exploring similar questions and additional content below.Similar questions
- Medicare spending per patient in different U.S. metropolitan areas may differ. Based on the sample data below, answer the questions that follow to determine whether the average spending in the northern region is significantly less than the average spending in the southern region at the 1 percent level. statistic Northern Region Southern Region sample mean 4,327 6,865 sample standard deviation 1,476 3,602 sample size 11 15 1. Specify the decision rule 2. Find the test statistic (t calc) assuming unequal variancesarrow_forwardWhat is the Sample Skewness for the following numbers: mean of 100.89 , median of 95, and standard deviation of 52.38?arrow_forwardA teacher collects the following data from 5 college students regarding the number of times they drank alcohol in the last 30 days. We know that the population of college students drink a mean of 4.0 days in the last 30 days (i.e., this is the population mean). Is the mean level in the sample significantly different from the population mean? data: 6,5, 7, 6, 4 - what type of error might you be making - interpret effect sizearrow_forward
- Where are the deer? Random samples of square-kilometer plots were taken in different ecological locations of a national park. The deer counts per square kilometer were recorded and are shown in the following table. Mountain Brush Sagebrush Grassland Pinon Juniper 30 20 5 25 59 10 25 16 2 24 19 4 Shall we reject or accept the claim that there is no difference in the mean number of deer per square kilometer in these different ecological locations? Use a 5% level of significance. (a) What is the level of significance?State the null and alternate hypotheses. Ho: ?1 = ?2 = ?3; H1: Exactly two means are equal.Ho: ?1 = ?2 = ?3; H1: At least two means are equal. Ho: ?1 = ?2 = ?3; H1: All three means are different.Ho: ?1 = ?2 = ?3; H1: Not all the means are equal. (b) Find SSTOT, SSBET, and SSW and check that SSTOT = SSBET + SSW. (Use 3 decimal places.) SSTOT = SSBET = SSW = Find d.f.BET, d.f.W, MSBET, and MSW. (Use 2 decimal places for MSBET, and MSW.)…arrow_forwardWhere are the deer? Random samples of square-kilometer plots were taken in different ecological locations of a national park. The deer counts per square kilometer were recorded and are shown in the following table. Mountain Brush Sagebrush Grassland Pinon Juniper 35 17 2 30 53 6 20 19 2 26 19 8 Shall we reject or accept the claim that there is no difference in the mean number of deer per square kilometer in these different ecological locations? Use a 5% level of significance. (a) What is the level of significance? State the null and alternate hypotheses. Ho: μ1 = μ2 = μ3; H1: All three means are different.Ho: μ1 = μ2 = μ3; H1: Exactly two means are equal. Ho: μ1 = μ2 = μ3; H1: Not all the means are equal.Ho: μ1 = μ2 = μ3; H1: At least two means are equal. (b) Find SSTOT, SSBET, and SSW and check that SSTOT = SSBET + SSW. (Use 3 decimal places.) SSTOT = SSBET = SSW = Find d.f.BET, d.f.W, MSBET, and MSW. (Use 2 decimal places for MSBET, and MSW.)…arrow_forwardA small hospital wants to create a more welcoming environment for patients with mental illnesses--starting with employee training. As part of a pre-training assessment, employees complete a 10-point Attitudes Toward Mental Illness scale (higher = more positive attitudes). The pre-training data are: 4, 10, 2, 7, 7, 6, 6 Make a Frequency Table 1 Make a Frequency Histogram 2 Find the mean, median & mode 3 Calculate the SD What are the (pre-training) employee attitudes toward mental illness like?arrow_forward
- kshe The height of women ages 20-29 is normally distributed, with a mean of 64.6 inches. Assume o = 2.9 inches. Are you more likely to randomly select 1 woman with a e score les (fo height less than 66.4 inches or are you more likely to select a sample of 30 women with a mean height less than 66.4 inches? Explain. E . Click the icon to view page 1 of the standard normal table. signme ee score A Click the icon to view page 2 of the standard normal table. radeboc What is the probability of randomly selecting 1 woman with a height less than 66.4 inches? e score mail O (Round to four decimal places as needed.) What is the probability of selecting a sample of 30 women with a mean height less than 66.4 inches? Text (Round to four decimal places as needed.) Accessibl Resource Are you more likely to randomly select 1 woman with a height less than 66.4 inches or are you more likely to select a sample of 30 women with a mean height less than 66.4 inches? Choose the correct answer below. Tools…arrow_forward1. Comment on the shape of the distribution. 2. Use the empirical rule to state the percentage of annual sales between 1255 and 9181(millions of dollars) 3. Based on the z score, is the highest sale, $14138 (in millions) an outlier? Explainarrow_forwardWhat is the Sample Skewness for the following numbers:mean of 106.89 , median of 87, and standard deviation of 54.36?arrow_forward
- According to the USDA, the mean intake of calories of males 20-39 is 2716 with a standard deviation of 72.8Would you find it unusual to have a sample mean of 2750 or higher for a sample size of 35? Why?arrow_forwardA professional marketing survey involves product recognition in New York and California. Of 558 New York residents surveyed, 193 knew the product while 179 out of 614 Californians knew the product. 1. Test the claim that the recognition rates are greater in New York. 2. In which state does the product need the most help with name recognition? Use the given data to compare mean age of residents in Seaside and Marina. Sample Data * = 43.2 yr s = 4.7 yr n = 97 Seaside Before After 1. Test the claim that the mean age of seaside residents is equal to the mean age of Marina residents. 2. How would the result change if we use a = 0.01? Matched Pairs: Write the alternative hypothesis H₁, for each claim: 1. New engine management software will increase the gas mileage in your car. 2. My coaching will reduce your golf score. Difference An instructor gives a test before and after a lesson with these results from randomly selected students Before and After Data 54 70 = 61 Marina 56 s = 6.7 year…arrow_forwardplease help me find the test statistic and p-value!arrow_forward
arrow_back_ios
SEE MORE QUESTIONS
arrow_forward_ios
Recommended textbooks for you
 MATLAB: An Introduction with ApplicationsStatisticsISBN:9781119256830Author:Amos GilatPublisher:John Wiley & Sons Inc
 Probability and Statistics for Engineering and th...StatisticsISBN:9781305251809Author:Jay L. DevorePublisher:Cengage Learning
 Statistics for The Behavioral Sciences (MindTap C...StatisticsISBN:9781305504912Author:Frederick J Gravetter, Larry B. WallnauPublisher:Cengage Learning
 Elementary Statistics: Picturing the World (7th E...StatisticsISBN:9780134683416Author:Ron Larson, Betsy FarberPublisher:PEARSON
 The Basic Practice of StatisticsStatisticsISBN:9781319042578Author:David S. Moore, William I. Notz, Michael A. FlignerPublisher:W. H. Freeman
 Introduction to the Practice of StatisticsStatisticsISBN:9781319013387Author:David S. Moore, George P. McCabe, Bruce A. CraigPublisher:W. H. Freeman

MATLAB: An Introduction with Applications
Statistics
ISBN:9781119256830
Author:Amos Gilat
Publisher:John Wiley & Sons Inc

Probability and Statistics for Engineering and th...
Statistics
ISBN:9781305251809
Author:Jay L. Devore
Publisher:Cengage Learning

Statistics for The Behavioral Sciences (MindTap C...
Statistics
ISBN:9781305504912
Author:Frederick J Gravetter, Larry B. Wallnau
Publisher:Cengage Learning

Elementary Statistics: Picturing the World (7th E...
Statistics
ISBN:9780134683416
Author:Ron Larson, Betsy Farber
Publisher:PEARSON

The Basic Practice of Statistics
Statistics
ISBN:9781319042578
Author:David S. Moore, William I. Notz, Michael A. Fligner
Publisher:W. H. Freeman

Introduction to the Practice of Statistics
Statistics
ISBN:9781319013387
Author:David S. Moore, George P. McCabe, Bruce A. Craig
Publisher:W. H. Freeman