
MATLAB: An Introduction with Applications
6th Edition
ISBN: 9781119256830
Author: Amos Gilat
Publisher: John Wiley & Sons Inc
expand_more
expand_more
format_list_bulleted
Related questions
Question
using r- studio please cod the following parts a-h

Transcribed Image Text:=
pri-
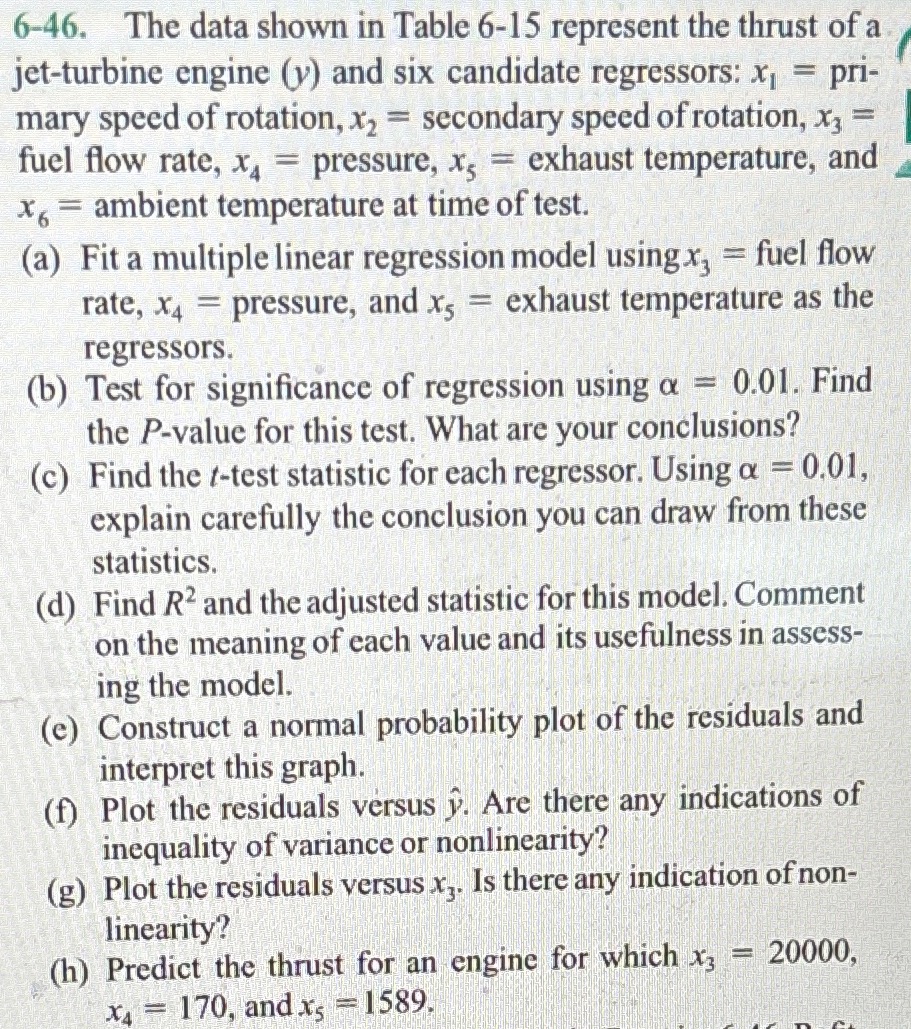
6-46. The data shown in Table 6-15 represent the thrust of a
jet-turbine engine (y) and six candidate regressors: x₁
mary speed of rotation, x₂ = secondary speed of rotation, x3
fuel flow rate, x = pressure, x, = exhaust temperature, and
x6 = ambient temperature at time of test.
(a) Fit a multiple linear regression model using x, = fuel flow
rate, x4 pressure, and x5 exhaust temperature as the
=
=
regressors.
(b) Test for significance of regression using a = 0.01. Find
the P-value for this test. What are your conclusions?
(c) Find the t-test statistic for each regressor. Using a = 0.01,
explain carefully the conclusion you can draw from these
statistics.
(d) Find R2 and the adjusted statistic for this model. Comment
on the meaning of each value and its usefulness in assess-
ing the model.
(e) Construct a normal probability plot of the residuals and
interpret this graph.
(f) Plot the residuals versus y. Are there any indications of
inequality of variance or nonlinearity?
(g) Plot the residuals versus x3. Is there any indication of non-
linearity?
(h) Predict the thrust for an engine for which x3
-
X4 = 170, and x = 1589.
= 20000,

Transcribed Image Text:Y
X4 X5 X6
4540 2140 20640 30250 205 1732 99
X1 X2
X3
نت
4315 2016 20280 30010 195 1697 100
4095 1905 19860
29780 184 1662 97
3650 1675 18980
29330 164 1598 97
3200 1474 18100 28960 144 1541 97
4833 2239 20740 30083 215 1709 87
4617 2120 20305 29831 206 1669 87
4340 1990 19961 29604 195 1640 87
3820 1702 18916 29088 171 1572 85
3368 1487 18012 28675 149 1522 85
4445 2107 20520 30120 195 1740 101
4188 1973 20130 29920 190 1711 100
3981 1864 19780 29720 180 1682 100
3622 1674 19020 29370 161 1630 100
3125 1440 18030
1572 101
4560 2165 20680 30160
208 1704 98
4340 2048 20340 29960 199
1679 96
4115 1916 19860
29710 187 1642 94
3630 1658 18950
29250 164 1576 94
3210 1489 18700
28890 145 1528 94
4330 2062 20500
30190 193 1748 101
4119 1929 20050 29960 183 1713 100
3891 1815 19680 29770 173 1684 100
3467 1595 18890 29360 153 1624 99
3045 1400 17870 28960 134 1569 100
4411 2047 20540 30160 193 1746 99
4203 1935 20160 29940 184 1714 99
3968 1807 19750 29760 173 1679 99
28940 139
3531 1591 18890 29350 153 1621 99
3074 1388 17870 28910 133 1561 99
4350 2071 20460 30180 198 1729 102
4128 1944 20010 29940 186 1692 101
3940 1830 19640 29750 178 1667 101
3480 1612 18710 29360 156 1609 101
3064 1410 17780 28900 136 1552 101
4402 2066 20520 30170 197 1758 100
4180 1954 20150 29950 188 1729 99
3973 1835 19750 29740 178 1690 99
3530 1616 18850 29320 156 1616 99
3080 1407 17910 28910 137 1569 100
Expert Solution
This question has been solved!
Explore an expertly crafted, step-by-step solution for a thorough understanding of key concepts.

This is a popular solution
Step 1: Given information
VIEW Step 2: (a) Fitting of multiple linear regression model using x3, x4, and x5 as regressor
VIEW Step 3: (b) Finding the p-value for the test and drawing conclusion
VIEW Step 4: (c) Finding t-test statistics for each regressor using level of significance 0.01
VIEW Step 5: (d) Finding R^2 and adjusted R^2 for the model
VIEW Step 6: (e) Construing the Normal probability plot of the model and interpretation of the graph
VIEW Step 7: (f) Plotting the residuals vs fitted value of the dependent variable
VIEW Step 8: (g) Plotting the residuals versus x3
VIEW Step 9: (h) Prediction for the thrust for engine for which x3=20000, x4=170, and x5=1589
VIEW Solution
VIEW 
Trending nowThis is a popular solution!

Step by stepSolved in 10 steps with 54 images

Knowledge Booster

Similar questions
arrow_back_ios
arrow_forward_ios
Recommended textbooks for you
- MATLAB: An Introduction with ApplicationsStatisticsISBN:9781119256830Author:Amos GilatPublisher:John Wiley & Sons Inc
 Probability and Statistics for Engineering and th...StatisticsISBN:9781305251809Author:Jay L. DevorePublisher:Cengage Learning
 Statistics for The Behavioral Sciences (MindTap C...StatisticsISBN:9781305504912Author:Frederick J Gravetter, Larry B. WallnauPublisher:Cengage Learning
  Elementary Statistics: Picturing the World (7th E...StatisticsISBN:9780134683416Author:Ron Larson, Betsy FarberPublisher:PEARSON
 The Basic Practice of StatisticsStatisticsISBN:9781319042578Author:David S. Moore, William I. Notz, Michael A. FlignerPublisher:W. H. Freeman
 Introduction to the Practice of StatisticsStatisticsISBN:9781319013387Author:David S. Moore, George P. McCabe, Bruce A. CraigPublisher:W. H. Freeman
MATLAB: An Introduction with Applications
Statistics
ISBN:9781119256830
Author:Amos Gilat
Publisher:John Wiley & Sons Inc
Probability and Statistics for Engineering and th...
Statistics
ISBN:9781305251809
Author:Jay L. Devore
Publisher:Cengage Learning
Statistics for The Behavioral Sciences (MindTap C...
Statistics
ISBN:9781305504912
Author:Frederick J Gravetter, Larry B. Wallnau
Publisher:Cengage Learning
Elementary Statistics: Picturing the World (7th E...
Statistics
ISBN:9780134683416
Author:Ron Larson, Betsy Farber
Publisher:PEARSON
The Basic Practice of Statistics
Statistics
ISBN:9781319042578
Author:David S. Moore, William I. Notz, Michael A. Fligner
Publisher:W. H. Freeman
Introduction to the Practice of Statistics
Statistics
ISBN:9781319013387
Author:David S. Moore, George P. McCabe, Bruce A. Craig
Publisher:W. H. Freeman