
MATLAB: An Introduction with Applications
6th Edition
ISBN: 9781119256830
Author: Amos Gilat
Publisher: John Wiley & Sons Inc
expand_more
expand_more
format_list_bulleted
Related questions
Concept explainers
Topic Video
Question
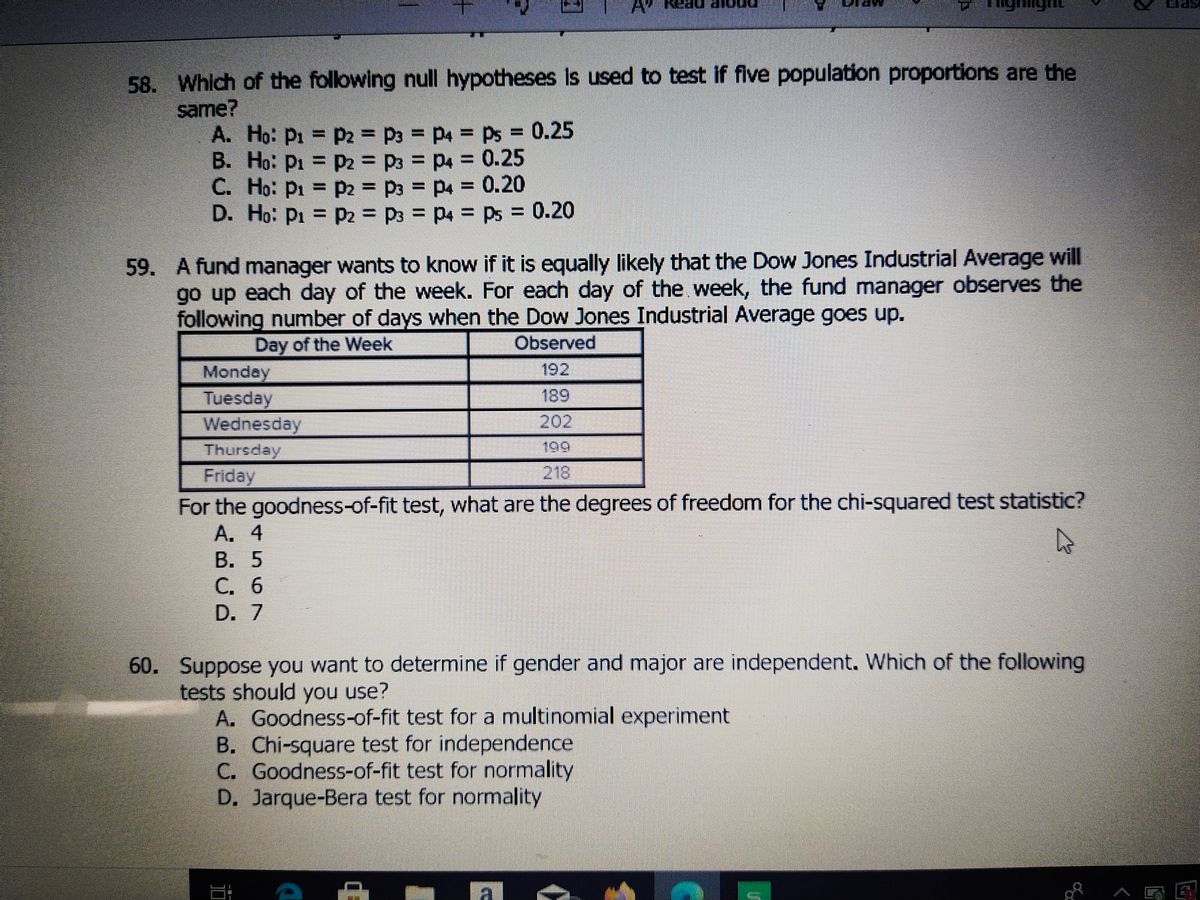

Transcribed Image Text:58. Which of the following null hypotheses is used to test if five population proportions are the
same?
A. Ho: P1 = P2 = P3 P4 Ps 0.25
B. Ho: Pi = P2 P3 = P4 = 0.25
C. Ho: Pi = p2 = P3 = P4 = 0.20
D. Ho: Pi = P2 = P3 = P4 = Ps = 0.20
%3D
%3D
%3D
%3D
%3D
%3D
%3D
%3D
59. A fund manager wants to know if it is equally likely that the Dow Jones Industrial Average will
go up each day of the week. For each day of the week, the fund manager observes the
following number of days when the Dow Jones Industrial Average goes up.
Observed
Day of the Week
Monday
Tuesday
Wednesday
192
189
202
Thursday
199
218
Friday
For the goodness-of-fit test, what are the degrees of freedom for the chi-squared test statistic?
A. 4
B. 5
C. 6
D. 7
60. Suppose you want to determine if gender and major are independent. Which of the following
tests should you use?
A. Goodness-of-fit test for a multinomial experiment
B. Chi-square test for independence
C. Goodness-of-fit test for normality
D. Jarque-Bera test for normality
a
Expert Solution
This question has been solved!
Explore an expertly crafted, step-by-step solution for a thorough understanding of key concepts.

This is a popular solution

Trending nowThis is a popular solution!

Step by stepSolved in 2 steps with 3 images

Knowledge Booster


Learn more about
Need a deep-dive on the concept behind this application? Look no further. Learn more about this topic, statistics and related others by exploring similar questions and additional content below.Similar questions
- Suppose that the proportion of investors who are risk-averse (that is, try to avoid risk in their investment decisions) is though to be at least 0.6. A financial advisor believes that the proportion is actually less than 0.6. A survey of 28 investors found that 16 of them were risk-averse. Formulate a one-sample hypothesis test for a proportion to test this belief. Determine the null hypothesis, Ho, and the alternative hypothesis, H₁. Ho 2 0.6 H₁ 0.6 (Type integers or decimals. Do not round.) Compute the test statistic. (Round to two decimal places as needed.) 4 Darrow_forwardYou wish to test the following claim (Ha) at a significance level of a = 0.001. H.:µ = 79.1 Ha:u < 79.1 You believe the population is normally distributed, but you do not know the standard deviation. You obtain a sample of size n = 581 with a mean of M = 77.9 and a standard deviation of SD = 11.7. What is the critical value for this test? (Report answer accurate to three decimal places.) critical value = What is the test statistic for this sample? (Report answer accurate to three decimal places.) test statistic = The test statistic is... O in the critical region O not in the critical region This test statistic leads to a decision to... O reject the null O accept the null O fail to reject the null hp %23 3.arrow_forwardThe contingency table shows the results of a random sample of adults who watch movies on Netflix. At , can you conclude that the type of movie watched is independent of the age of the adult? Age Type of Movie Watched 18-24 25-34 35-44 45-64 65 + Comedy 38 30 24 10 8 Action 15 17 16 9 5 Drama 12 11 19 25 13 1. State the hypotheses. 2. Calculate the test statistic. 3. Calculate the p-value. 4. Decision: Reject H0 or Fail to Reject H0 5. Conclusion:arrow_forward
- Suppose that 6 people sign up for a weight loss program. You collect their weights before and after the program: The lower bound for the 95% Confidence Interval is ........... (round your answer to three decimal places). Person Before After 1 136 125 2 205 195 3 157 150 4 138 140 5 175 165 6 166 160arrow_forwardSuppose that the proportion of investors who are risk-averse (that is, try to avoid risk in their investment decisions) is though to be at least 0.7. A financial advisor believes that the proportion is actually less than 0.7. A survey of 36 investors found that 24 of them were risk-averse. Formulate a one-sample hypothesis test for a proportion to test this belief. Determine the null hypothesis, H,, and the alternative hypothesis, H,. Ho H,: (Type integers or decimals. Do not round.)arrow_forward12. Determine whether or not the given data sets are correlated at 0.01 level of confidence: x 0 2 3 5 6 6y 5.8 5.7 5.2 2.8 1.9 2.2Use the formal hypothesis test method. please show how to solve it. no excel pleasearrow_forward
- Suppose that the proportion of investors who are risk-averse (that is, try to avoid risk in their investment decisions) is though to be at least 0.6. A financial advisor believes that the proportion is actually less than 0.6. A survey of 32 investors found that 20 of them were risk-averse. Formulate a one-sample hypothesis test for a proportion to test this belief. Determine the null hypothesis, H,, and the alternative hypothesis, H,. Ho H,: (Type integers or decimals. Do not round.) Compute the test statistic. (Round to two decimal places as needed.) Find the p-value for the test. (Round to three decimal places as needed.) State the conclusion at the 0.05 level of significance. The p-value is the chosen value of a, so V the null hypothesis. There is evidence to conclude that the proportion of investors who are risk-averse is not at least 0.6.arrow_forward6. A researcher takes a sample of people, and asks them how they would vote for president. When she creates her confidence interval, she has a standard error of .082. If she wanted to get a smaller standard error, what could she do? Group of answer choices Ask a different research question. Take a smaller sample. Take a larger sample. None of the above would create a smaller standard error.arrow_forwardNear the time of an election, a cable news service performs an opinion poll of 1,000 probable voters. It shows that the Republican contender has an advantage of 54% to 48%. a. Develop a 95% confidence interval for the proportion favoring the Republican candidate. b. Estimate the probability that the Democratic candidate is actually leading. c. Repeat the above analysis based on a sample of 2,000 probable voters.arrow_forward
- Suppose that the proportion of investors who are risk-averse (that is, try to avoid risk in their investment decisions) is though to be at least 0.6. A financial advisor believes that the proportion is actually less than 0.6. A survey of 30 investors found that 18 of them were risk-averse. Formulate a one-sample hypothesis test for a proportion to test this belief. ..... Determine the null hypothesis, H,, and the alternative hypothesis, H,. 2 0.6 < 0.6 Ho: I H,: I (Type integers or decimals. Do not round.) Compute the test statistic. (Round to two decimal places as needed.)arrow_forwardSuppose that the proportion of investors who are risk-averse (that is, try to avoid risk in their investment decisions) is though to be at least 0.7. A financial advisor believes that the proportion is actually less than 0.7. A survey of 35 investors found that 23 of them were risk-averse. Formulate a one-sample hypothesis test for a proportion to test this belief. Determine the null hypothesis, H,, and the alternative hypothesis, H,. Ho H,: (Type integers or decimals. Do not round.) Compute the test statistic. (Round to two decimal places as needed.) Find the p-value for the test. (Round to three decimal places as needed.) State the conclusion at the 0.05 level of significance. The p-value is V the chosen value of a, so the null hypothesis. There is evidence to conclude that the proportion of investors who are risk-averse is not at least 0.7.arrow_forward1. If the chance for a student passing a class is 50%, then the chance for a student not passing the class can be greater than 50%? true or false 2. 1.30% is not a true probability? true or false 3. Power is 1 minus the probability of making a type I error? true or false 4. Using the same sample data, the margin of error for an 80% confidence interval is bigger than the margin of error for a 90% confidence interval? true or falsearrow_forward
arrow_back_ios
SEE MORE QUESTIONS
arrow_forward_ios
Recommended textbooks for you
- MATLAB: An Introduction with ApplicationsStatisticsISBN:9781119256830Author:Amos GilatPublisher:John Wiley & Sons Inc
 Probability and Statistics for Engineering and th...StatisticsISBN:9781305251809Author:Jay L. DevorePublisher:Cengage Learning
 Statistics for The Behavioral Sciences (MindTap C...StatisticsISBN:9781305504912Author:Frederick J Gravetter, Larry B. WallnauPublisher:Cengage Learning
  Elementary Statistics: Picturing the World (7th E...StatisticsISBN:9780134683416Author:Ron Larson, Betsy FarberPublisher:PEARSON
 The Basic Practice of StatisticsStatisticsISBN:9781319042578Author:David S. Moore, William I. Notz, Michael A. FlignerPublisher:W. H. Freeman
 Introduction to the Practice of StatisticsStatisticsISBN:9781319013387Author:David S. Moore, George P. McCabe, Bruce A. CraigPublisher:W. H. Freeman
MATLAB: An Introduction with Applications
Statistics
ISBN:9781119256830
Author:Amos Gilat
Publisher:John Wiley & Sons Inc
Probability and Statistics for Engineering and th...
Statistics
ISBN:9781305251809
Author:Jay L. Devore
Publisher:Cengage Learning
Statistics for The Behavioral Sciences (MindTap C...
Statistics
ISBN:9781305504912
Author:Frederick J Gravetter, Larry B. Wallnau
Publisher:Cengage Learning
Elementary Statistics: Picturing the World (7th E...
Statistics
ISBN:9780134683416
Author:Ron Larson, Betsy Farber
Publisher:PEARSON
The Basic Practice of Statistics
Statistics
ISBN:9781319042578
Author:David S. Moore, William I. Notz, Michael A. Fligner
Publisher:W. H. Freeman
Introduction to the Practice of Statistics
Statistics
ISBN:9781319013387
Author:David S. Moore, George P. McCabe, Bruce A. Craig
Publisher:W. H. Freeman