
MATLAB: An Introduction with Applications
6th Edition
ISBN: 9781119256830
Author: Amos Gilat
Publisher: John Wiley & Sons Inc
expand_more
expand_more
format_list_bulleted
Related questions
Concept explainers
Question
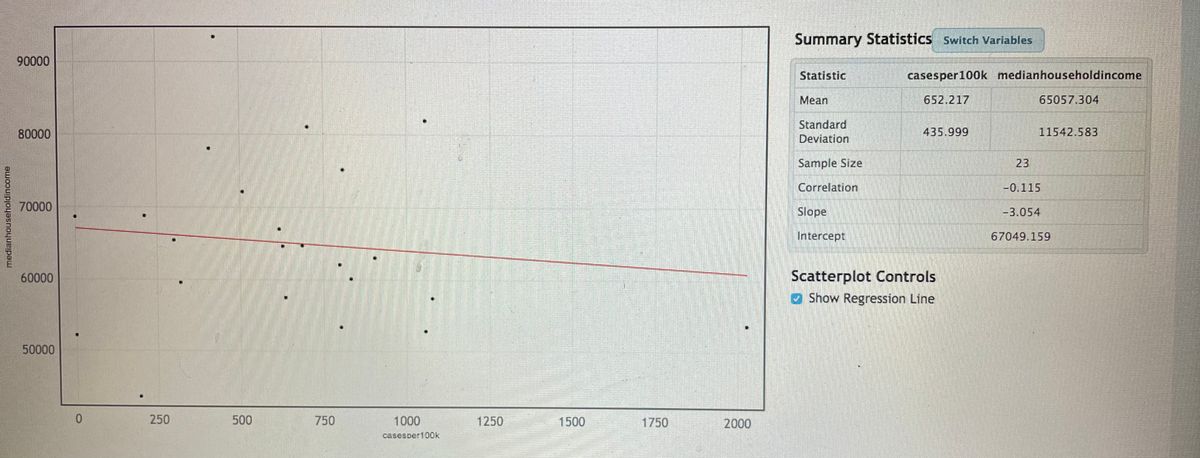

Transcribed Image Text:Summary Statistics Switch Variables
90000
Statistic
casesper100k medianhouseholdincome
Mean
652.217
65057.304
Standard
Deviation
80000
435.999
11542.583
Sample Size
23
Correlation
-0.115
70000
Slope
-3.054
Intercept
67049.159
Scatterplot Controls
O Show Regression Line
60000
50000
0.
250
500
750
1000
1250
1500
1750
2000
casesper100k
medianhouseholdincome

Transcribed Image Text:5.Interpret the Y intercept in context. If you feel y intercept doesn't make sense in this case
explain why.
6. Interpret the slope in context.
7. Using the scatterplot find the data point that appears to have the largest positive residual
(give the x and y coordinate)
X= Y%3D
8. compute the residual for the data point you found in #7.
Residual =
Show work
9. List a possible confounding variable and explain why you believe it is a confounding variable
Expert Solution
This question has been solved!
Explore an expertly crafted, step-by-step solution for a thorough understanding of key concepts.

This is a popular solution

Trending nowThis is a popular solution!

Step by stepSolved in 4 steps

Knowledge Booster


Learn more about
Need a deep-dive on the concept behind this application? Look no further. Learn more about this topic, statistics and related others by exploring similar questions and additional content below.Similar questions
- How much should a healthy Shetland pony weigh? Let x be the age of the pony (in months), and let y be the average weight of the pony (in kilograms). x 3 6 12 15 21 y 60 95 140 172 173 (a) Make a scatter diagram of the data and visualize the line you think best fits the data. A scatter diagram has a horizontal axis labeled "x (age (in months))" with values from 60 to 173 and a vertical axis labeled "y (average weight (in kg))" with values from 3 to 21. The scatter diagram has 5 points. A pattern goes up and right from (60, 3) to (173, 21). A scatter diagram has a horizontal axis labeled "x (age (in months))" with values from 3 to 21 and a vertical axis labeled "y (average weight (in kg))" with values from 60 to 173. The scatter diagram has 5 points. A pattern goes down and right from (3, 173) to (21, 60). A scatter diagram has a horizontal axis labeled "x (age (in months))" with values from 3 to 21 and a vertical axis labeled "y (average weight (in kg))" with…arrow_forwardThe table describes the height of a weather balloon, in meters, minutes after its launch. Time (minutes) Height (meters) 0 60 1 68.2 2 74.3 3 80.9 4 89.7 8 128.5 Select which equation best models the data. O O O O y = 8.52 +58 y = 8.2x + 60 y = 11.4x +57 y = 11.8x + 54arrow_forwardHow much should a healthy Shetland pony weigh? Let x be the age of the pony (in months), and let y be the average weight of the pony (in kilograms). x 3 6 12 20 26 y 60 95 140 160 189 (a) Make a scatter diagram of the data and visualize the line you think best fits the data. Flash Player version 10 or higher is required for this question. You can get Flash Player free from Adobe's website. (b) Would you say the correlation is low, moderate, or strong? low moderate strong Would you say the correlation is positive or negative? positive negative (c) Use a calculator to verify that x = 67, x2 = 1265, y = 644, y2 = 93,546, and xy = 10,544. Compute r. (Round your answer to three decimal places.) As x increases from 3 to 26 months, does the value of r imply that y should tend to increase or decrease? Explain your answer. Given our value of r, y should…arrow_forward
- Part d The slope is?arrow_forwardBelow is the actual data on the speed a person walks or runs in miles/hour and the calories the person burns per lap. Find the linear equation of best fit for this data. Compare the model to the data. Does the model seem to fit the data? Explain. What is the significance of the y-intercept? What is the slope and what does it mean? What is the x-intercept and what does it mean? What is the correlation coefficient and what does it mean? Speed (mph) Calories/lap 1 42 2 31 3 27 4 41 5 40 6 40 7 39 8 38 r answers to the nearest hundredth. The y-intercept means that if a person runs at ----------mph they will burn__________ per lap. The slope means that for each mph you increase your speed, you will burn an additional------------calories pay laparrow_forwardThe table lists data that is exactly linear. 4 24 33 54 62 (a) Find the slope-intercept form of the line that passes through these data points. (b) Predict y when x= - 1.8 and 5.8. Decide if these calculations involve interpolation or extrapolation. 95.5 39.5 14.3 - 44.5 - 66.9 x+ D (a) The slope-intercept form of the line that passes through these data points is y = (Simplify your answers. Use integers or decimals for any numbers in the equation.) (b) Predict y when x= - 1.8. y = (Simplify your answer. Round to the nearest hundredth.) Predicting y for this value of x is an example of which of the following? interpolation extrapolation Predict y when x = 5.8. y= (Simplify your answer. Round to the nearest hundredth.) Predicting y for this value of x is an example of which of the following? interpolation extrapolationarrow_forward
arrow_back_ios
arrow_forward_ios
Recommended textbooks for you
- MATLAB: An Introduction with ApplicationsStatisticsISBN:9781119256830Author:Amos GilatPublisher:John Wiley & Sons Inc
 Probability and Statistics for Engineering and th...StatisticsISBN:9781305251809Author:Jay L. DevorePublisher:Cengage Learning
 Statistics for The Behavioral Sciences (MindTap C...StatisticsISBN:9781305504912Author:Frederick J Gravetter, Larry B. WallnauPublisher:Cengage Learning
  Elementary Statistics: Picturing the World (7th E...StatisticsISBN:9780134683416Author:Ron Larson, Betsy FarberPublisher:PEARSON
 The Basic Practice of StatisticsStatisticsISBN:9781319042578Author:David S. Moore, William I. Notz, Michael A. FlignerPublisher:W. H. Freeman
 Introduction to the Practice of StatisticsStatisticsISBN:9781319013387Author:David S. Moore, George P. McCabe, Bruce A. CraigPublisher:W. H. Freeman
MATLAB: An Introduction with Applications
Statistics
ISBN:9781119256830
Author:Amos Gilat
Publisher:John Wiley & Sons Inc
Probability and Statistics for Engineering and th...
Statistics
ISBN:9781305251809
Author:Jay L. Devore
Publisher:Cengage Learning
Statistics for The Behavioral Sciences (MindTap C...
Statistics
ISBN:9781305504912
Author:Frederick J Gravetter, Larry B. Wallnau
Publisher:Cengage Learning
Elementary Statistics: Picturing the World (7th E...
Statistics
ISBN:9780134683416
Author:Ron Larson, Betsy Farber
Publisher:PEARSON
The Basic Practice of Statistics
Statistics
ISBN:9781319042578
Author:David S. Moore, William I. Notz, Michael A. Fligner
Publisher:W. H. Freeman
Introduction to the Practice of Statistics
Statistics
ISBN:9781319013387
Author:David S. Moore, George P. McCabe, Bruce A. Craig
Publisher:W. H. Freeman