
Database System Concepts
7th Edition
ISBN: 9780078022159
Author: Abraham Silberschatz Professor, Henry F. Korth, S. Sudarshan
Publisher: McGraw-Hill Education
expand_more
expand_more
format_list_bulleted
Related questions
Question
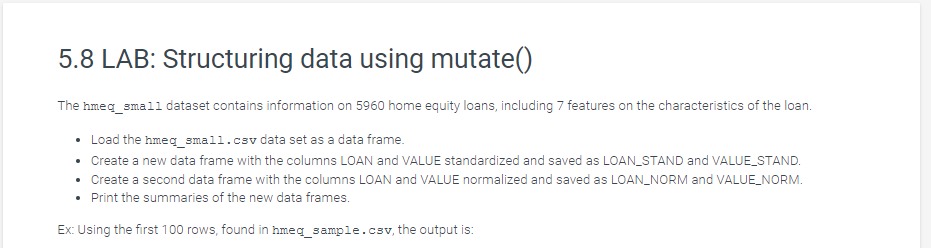

Transcribed Image Text:5.8 LAB: Structuring data using mutate()
The hmeq_small dataset contains information on 5960 home equity loans, including 7 features on the characteristics of the loan.
• Load the hmeq_small.csv data set as a data frame.
• Create a new data frame with the columns LOAN and VALUE standardized and saved as LOAN STAND and VALUE_STAND.
• Create a second data frame with the columns LOAN and VALUE normalized and saved as LOAN_NORM and VALUE_NORM.
• Print the summaries of the new data frames.
Ex: Using the first 100 rows, found in hmeq_sample.csv, the output is:
Expert Solution
This question has been solved!
Explore an expertly crafted, step-by-step solution for a thorough understanding of key concepts.

Step by stepSolved in 2 steps

Knowledge Booster

Similar questions
- 17. List the network names and the number of shows per network. Take a screenshot now and paste it here. 18. List the average number of episodes in the table shows. Take a screenshot now and paste it here. 19. List the name of the shows that have more episodes than the average number of episodes in the table shows. Use a subquery. Do not hardcode the average number (that you obtained in the previous question). Take a screenshot now and paste it here.arrow_forwardData Frame: import numpy as npimport pandas as pdnp.random.seed(1)import datetimetoday = datetime.date.today()someday = datetime.date(2016, 1, 1)diff = today - somedayrows,cols = diff.days,6data = np.random.rand(rows,cols) tidx = pd.date_range('2016-01-01', periods=rows, freq='D')data_frame = pd.DataFrame(data, columns=['a','b','c','d','e','f'], index=tidx)print(data_frame) Question - Calculate the cumulative sum of the Data frame (using the <DataFrame>.cumsum() function) andstore it in a new data frame called: df_accumulate and Plot the six sets of row values of df_accumulate in a grapharrow_forward2. Click on the word "earth" on the bottom left side of the page to see the map attributes. Observe the map attributes. What does SST stand for?arrow_forward
- Attach Tooth Growth in package datasets. What is the description of this data? (a) How can you inspect the structure of the data to show the first few parts of this data?. (b) The following is a sample from the ToothGrowth data. Describe how this data can be obtained and named Tooth. 2mg. len supp dose 23.6 VC 18.5 VC 33.9 VC 25.5 VC 2 26.4 VC 32.5 VC 2 26.7 VC 21.5 VC 23.3 VC 2 29.5 VC 2 25.5 OJ 2 26.4 OJ 22.4 OJ 24.5 OJ OJ OJ 24.8 2 30.9 26.4 OJ OJ OJ 27.3 2 29.4 23.0 OJ 2 (c) Obtain descriptive statistics for Tooth length due to each Supplement type. (d) Construct a histogram for each sample and comment on the distribution. Superimpose the density curve of the data on your histogram. Would you agree to the assertion that both are approximately normally distributed? (e) Are there any outliers in the data? (f) Are the means of the tooth lengths due to each Supplement type (VC or OJ) different? Test at 4% significant level. (g) Comment on your resultsarrow_forwardCreate a table with the foll columns. nae of employee (NAME, variable character) Date of birth(DOB, date) Salary of employee(SALARY,integer) Department(DEPT, variable character) [Department :SALE,ACCT,MARKETING]arrow_forwardAll geographic data-sets will have a coordinate system. that is used throughout ArcGIS to display, measure, and transform geographic data. If the coordinate system for a data-set is unknown or incorrect, you can use a specific tool to specify the correct coordinate system as you did this in this lab. You must know the correct coordinate system of the data-set before using this tool. The tool in ArcGIS Pro is called "Project" True Falsearrow_forward
- TODO 12 Let's now split our input data X and labels y into a train and test set using the train_test_split() function (docs). Here we'll use the 80-20 split rule where we use 80% of the data for training and 20% for testing. Lastly, we'll seed our split using the random_state keyword argument which will make sure we create the same split every time we run the function. Use the train_test_split() function to get a train and test split. Store the output into X_train, X_test, y_train, and y_test. Pass the required arguments X and y. Further specify we want to use 20% of the training data by setting the test_size keyword argument. Lastly, pass the keyword argument random_state=42 to set the random seed so we get the same split every time we run this code. Print the shape for X_train. Print the shape for y_train. Print the shape for X_test. Print the shape for y_test. # TODO 12.1X_train, X_test, y_train, y_test = todo_check([ (X_train.shape == (413, 29), 'X_train does not have the…arrow_forwardWe will use built in datasets to practice making plots in R. You need to save all plots and upload with your script. 1. We will use mtcars. So first define x as the wt column of mtcars and y as the mpg column of mtcars. a. How do you find out more about the mtcars, dataset? Provide a synopsis b. Make a plot using plot() and be sure to give it a main and axes title c. Change point shape to 19 using the pch parameter for the plot function and remove the framearrow_forwardI need helparrow_forward
- nycflights13::flights Q4<- flights %>%filter(carrier == "JFK") %>%summarise(average_dist = mean(distance)%>%summarise(max_dist = max(average_dist))%>%group_by(Q4, month, day)%>%head(Q4[order(dat$month),(dat$day),(dat$max_dist)],n=5) *not pictured, I did upload, tidy verse, dplyr, and the nycflights13 libraries. Error: Incomplete expression: Q4<- flights %>% filter(carrier == "JFK") %>% summarise(average_dist = mean(distance)%>% summarise(max_dist = max(average_dist))%>% group_by(Q4, month, day)%>% head(Q4[order(dat$month),(dat$day),(dat$max_dist)],n=5) RStudio Question: I can't figure out what is wrong with my code. Could someone take a look at it? See below for what I am trying to do, my code and my error output. I am trying to find what 5 days of the year had the highest mean distance from JFK airport, using the nycflights13 library. I want to format it in month, day, andvmean distance.arrow_forwardCan you add new data to a dataset that has been normalized using the decimal scaling normalization method?arrow_forwardDisplay a function that can rank the dataset based on subjectivity on Twitter scrapingarrow_forward
arrow_back_ios
SEE MORE QUESTIONS
arrow_forward_ios
Recommended textbooks for you
- Database System ConceptsComputer ScienceISBN:9780078022159Author:Abraham Silberschatz Professor, Henry F. Korth, S. SudarshanPublisher:McGraw-Hill Education
 Starting Out with Python (4th Edition)Computer ScienceISBN:9780134444321Author:Tony GaddisPublisher:PEARSON
 Digital Fundamentals (11th Edition)Computer ScienceISBN:9780132737968Author:Thomas L. FloydPublisher:PEARSON
  C How to Program (8th Edition)Computer ScienceISBN:9780133976892Author:Paul J. Deitel, Harvey DeitelPublisher:PEARSON
 Database Systems: Design, Implementation, & Manag...Computer ScienceISBN:9781337627900Author:Carlos Coronel, Steven MorrisPublisher:Cengage Learning
 Programmable Logic ControllersComputer ScienceISBN:9780073373843Author:Frank D. PetruzellaPublisher:McGraw-Hill Education
Database System Concepts
Computer Science
ISBN:9780078022159
Author:Abraham Silberschatz Professor, Henry F. Korth, S. Sudarshan
Publisher:McGraw-Hill Education
Starting Out with Python (4th Edition)
Computer Science
ISBN:9780134444321
Author:Tony Gaddis
Publisher:PEARSON
Digital Fundamentals (11th Edition)
Computer Science
ISBN:9780132737968
Author:Thomas L. Floyd
Publisher:PEARSON
C How to Program (8th Edition)
Computer Science
ISBN:9780133976892
Author:Paul J. Deitel, Harvey Deitel
Publisher:PEARSON
Database Systems: Design, Implementation, & Manag...
Computer Science
ISBN:9781337627900
Author:Carlos Coronel, Steven Morris
Publisher:Cengage Learning
Programmable Logic Controllers
Computer Science
ISBN:9780073373843
Author:Frank D. Petruzella
Publisher:McGraw-Hill Education