MATLAB: An Introduction with Applications
6th Edition
ISBN: 9781119256830
Author: Amos Gilat
Publisher: John Wiley & Sons Inc
expand_more
expand_more
format_list_bulleted
Topic Video
Question
thumb_up100%
This is mathematical statistics application question!

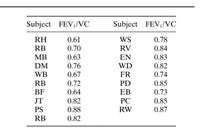
Transcribed Image Text:Subject FEV,/VC
Subject FEV,/VC
RH
0.61
WS
0.78
RB
0.70
RV
0.84
MB
0.63
EN
0.83
DM
0.76
WD
0.82
WB
0.67
FR
0.74
RB
0.72
PD
0.85
BF
0.64
ЕВ
0.73
0.85
0.87
JT
0.82
РС
PS
0.88
RW
RB
0.82

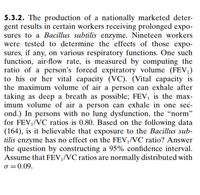
Transcribed Image Text:5.3.2. The production of a nationally marketed deter-
gent results in certain workers receiving prolonged expo-
sures to a Bacillus subtilis enzyme. Nineteen workers
were tested to determine the effects of those expo-
sures, if any, on various respiratory functions. One such
function, air-flow rate, is measured by computing the
ratio of a person's forced expiratory volume (FEV,)
to his or her vital capacity (VC). (Vital capacity is
the maximum volume of air a person can exhale after
taking as deep a breath as possible; FEV, is the max-
imum volume of air a person can exhale in one sec-
ond.) In persons with no lung dysfunction, the “norm"
for FEV,/VC ratios is 0.80. Based on the following data
(164), is it believable that exposure to the Bacillus sub-
tilis enzyme has no effect on the FEV,/VC ratio? Answer
the question by constructing a 95% confidence interval.
Assume that FEV¡/VC ratios are normally distributed with
o =0.09.
Expert Solution
This question has been solved!
Explore an expertly crafted, step-by-step solution for a thorough understanding of key concepts.
This is a popular solution
Trending nowThis is a popular solution!
Step by stepSolved in 3 steps with 1 images

Knowledge Booster
Learn more about
Need a deep-dive on the concept behind this application? Look no further. Learn more about this topic, statistics and related others by exploring similar questions and additional content below.Similar questions
- Week 4 3 2 1 Lisa's Race Times Miles 1 1 1 1 Time 15 min 14 min 12 min 15 min Which shows the mean race time? Back 15 +14+ 12 + 15 12 (15 + 14 + 12 + 15) + 4 15 × 14 × 12 x 15 × (4) Narrow_forwardWhat is the answer for the last question regarding the term to describe the data value that doesn't make sense? "Obviously the answer above makes no sense, and this is (in part) because no team in our data had a BA anywhere near .000. This is a textbook illustration of what term from the course? "arrow_forwardquestion 6 onlyarrow_forward
- The power of a study is 1 minus beta equal the probability that a researcher will reject H0when H0 is false. Can you tell me if this statement is True or Falsearrow_forwardSuppose you have access to a database with the variables listed below. Using the two variables BMI(the predictor) and diabetes(the outcome) Name two types of descriptive statistics you could report specifying the variables BMI and diabetes.arrow_forwardQUESTION1 What does the variable "student" represent? Yes vs. No Full time vs. Part time Student vs. Employee There is not a variable named student. QUESTION 2 How is "cigarette" being quantified? packs of cigarettes smoked each day # of cigarettes smoked each day packs of cigarettes smoked each month # of cigarettes smoked each week QUESTION 3 What does "upset" represent? (write this word for word from the SPSS file)arrow_forward
- Help me pleasearrow_forwardRecently, Goran ran for president of the local school board. Of those who voted in the election, 80% had a high school diploma, and the other 20% did not. Goran got 70% of the vote of those with high school diplomas, while he got only 15% of the vote of those without high school diplomas. Let D denote the event that a randomly chosen voter (in the school board election) had a high school diploma and D denote the event that a randomly chosen voter did not have a high school diploma. Let V denote the event that a randomly chosen voter voted for Goran and V denote the event that a randomly chosen voter did not vote for Goran. Fill in the probabilities to complete the tree diagram below, and then answer the question that follows. Do not round any of your responses. (If necessary, consult a list of formulas.) (a) Fill in the missing probabilities. P(VD) = 0.7 P(DnV) = 0 P (D) = 0.8 Continue Submit Assignme Privacy Center | Accessibili (4¹) Ⓒ2022 McGraw Hill LLC. All Rights Reserved. Terms…arrow_forwardQuestion 7- Part A. If Alex has scored 510 on the MCAT, and was at the 75th percentile, and Boris has scored 520, and was at the 95th percentile, then approximately how much percent (%) of all the students who wrote MCAT had the score lower than Boris and higher than Alex? Provide answer in Percentage.arrow_forward
arrow_back_ios
arrow_forward_ios
Recommended textbooks for you
 MATLAB: An Introduction with ApplicationsStatisticsISBN:9781119256830Author:Amos GilatPublisher:John Wiley & Sons Inc
 Probability and Statistics for Engineering and th...StatisticsISBN:9781305251809Author:Jay L. DevorePublisher:Cengage Learning
 Statistics for The Behavioral Sciences (MindTap C...StatisticsISBN:9781305504912Author:Frederick J Gravetter, Larry B. WallnauPublisher:Cengage Learning
 Elementary Statistics: Picturing the World (7th E...StatisticsISBN:9780134683416Author:Ron Larson, Betsy FarberPublisher:PEARSON
 The Basic Practice of StatisticsStatisticsISBN:9781319042578Author:David S. Moore, William I. Notz, Michael A. FlignerPublisher:W. H. Freeman
 Introduction to the Practice of StatisticsStatisticsISBN:9781319013387Author:David S. Moore, George P. McCabe, Bruce A. CraigPublisher:W. H. Freeman

MATLAB: An Introduction with Applications
Statistics
ISBN:9781119256830
Author:Amos Gilat
Publisher:John Wiley & Sons Inc

Probability and Statistics for Engineering and th...
Statistics
ISBN:9781305251809
Author:Jay L. Devore
Publisher:Cengage Learning

Statistics for The Behavioral Sciences (MindTap C...
Statistics
ISBN:9781305504912
Author:Frederick J Gravetter, Larry B. Wallnau
Publisher:Cengage Learning

Elementary Statistics: Picturing the World (7th E...
Statistics
ISBN:9780134683416
Author:Ron Larson, Betsy Farber
Publisher:PEARSON

The Basic Practice of Statistics
Statistics
ISBN:9781319042578
Author:David S. Moore, William I. Notz, Michael A. Fligner
Publisher:W. H. Freeman

Introduction to the Practice of Statistics
Statistics
ISBN:9781319013387
Author:David S. Moore, George P. McCabe, Bruce A. Craig
Publisher:W. H. Freeman