
MATLAB: An Introduction with Applications
6th Edition
ISBN: 9781119256830
Author: Amos Gilat
Publisher: John Wiley & Sons Inc
expand_more
expand_more
format_list_bulleted
Related questions
Question
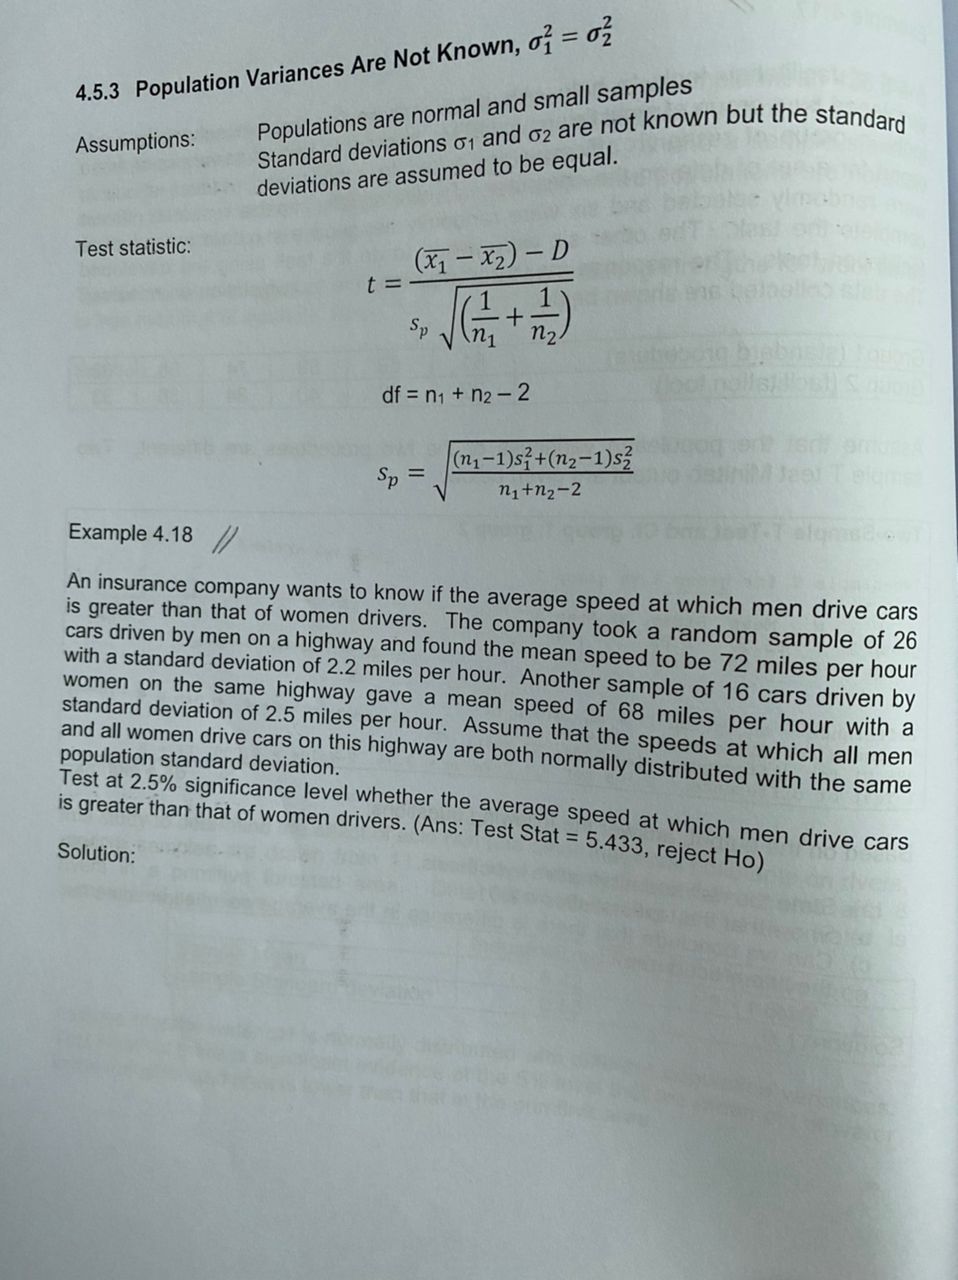

Transcribed Image Text:4.5.3 Population Variances Are Not Known, of = oź
Populations are normal and small samples
Assumptions:
deviations are assumed to be equal.
(x- x2) - D
t =
Test statistic:
1
Sp
21
n2.
df = n1 + n2-2
(n,-1)s;+(n2-1)s
Sp
n1+n2-2
Example 4.18
An insurance company wants to know if the average speed at which men drive cars
is greater than that of women drivers. The company took a random sample of 26
cars driven by men on a highway and found the mean speed to be 72 miles per hour
with a standard deviation of 2.2 miles per hour. Another sample of 16 cars driven by
women on the same highway gave a mean speed of 68 miles per hour with a
standard deviation of 2.5 miles per hour. Assume that the speeds at which all men
and all women drive cars on this highway are both normally distributed with the same
population standard deviation.
Test at 2.5% significance level whether the average speed at which men drive cars
is greater than that of women drivers. (Ans: Test Stat = 5.433, reject Ho)
Solution:

Transcribed Image Text:Example 4.17
A set of facilitation tools to help with data analysis for problem solving is being
developed by a group of statisticians at UITM. In order to test effectiveness of these
tools, a group of research officers were asked to analyze and produce a built-in
report for a set of data on the computer. Twelve equally capable research officers
were randomly selected and six were randomly assigned a standard procedure to
complete the task. The other six were asked to do the task using the developed
facilitation tools. The response measured was the time to completion (in minutes):
The data collected are shown below:
Group1 (standard procedure)
Group 2 (facilitation tool)
61
69
68
74
58
63
32
42
40
34
38
33
Assume that the population variances of the two procedures are different. Two
sample T test Minitab output are given below.
Two-Sample T-Test and CI: group 1; group 2
different
which ne better?
Two-sample T for group 1 vs group 2
Mean
StDev
SE Mean
1
6.
65.50
5.89
2.4
group
group 2
6.
36.50
4.09
1.7
> b TT better becau g
Difference = mu (group 1) - mu (group 2)
Estimate for difference:
dees not ins kde o. so there N a diffent
29.0000
98% CI for difference:
(20.5224; 37.4776)
P-Value = 0.000
DF = 8
T-Test of difference = 0 (vs not =): T-Value = 9.91
Based on the output, answer the following questions:
a) State the null and alternative hypothesis.
b) Show that the test statistics 9.91.
c) Can we conclude that there is difference in the average completion times for
the two procedures?
Sinie 9= 0
Solution:
Expert Solution
This question has been solved!
Explore an expertly crafted, step-by-step solution for a thorough understanding of key concepts.

Step by stepSolved in 2 steps

Knowledge Booster

Similar questions
- A group of adult males has foot lengths with a mean of 26.79 cm and a standard deviation of 1.27 cm. Use the range rule of thumb for identifying significant identify the limits separating values that are significantly low or significantly highIs the adult male foot length of 29.7 cm significantly low or significantly highExplain A random sample of 10 subjects have weights with a standard deviation of 14.0120 kgWhat is the variance of their weights? Be sure to include the appropriate u with the result The variance of the sample data isarrow_forwardiger 2. Hypothesis: College students sleep less than the recommended 8 hours. Data: Sample mean (X) = 7.25, sample standard deviation (Sx) = 2.1, N = 25.arrow_forwardWhich is not one of the major assumptions typically associated with parametric tests of significance? A. Random Selection B. Homogeneity of Variance C. Absence of restricted rangesarrow_forward
- The results of a state mathematics test for random samples of students taught by two different teachers at the same school are shown below. Can you conclude there is a difference in the mean mathematics test scores for the students of the two teachers? Use α = 0.01. In addition, assume the populations are normally distributed and the population variances/standard deviations are not equal. Teacher 1 Teacher 2 ?̅1 = 473 ?̅2 = 459 S1 = 39.7 S2 = 24.5 n 1 = 8 n 2 = 18 a. State the null and alternate hypotheses (write it mathematically) and write your claim. b. Find the test statistic c. Identify the Rejection region (critical region) and fail to reject region. Show this by drawing a curve and…arrow_forwardQ2: Serum amylase determinations were made on a sample of 15 apparently healthy subjects in the Electricity Power Plant of Nasriya January 2010. The sample yielded a mean of 96 and a standard deviation of 35 units/100ml. Estimate the true mean of serum amylase in the healthy population of Nasriya.arrow_forward#4data: 0.06, 0.11, 0.16, 0.15, 0.14, 0.08, 0.15. Use the sample data from #4 to construct a 98% confidence interval estimate for the standard deviation of the amount nitrogen-oxide emission for all cars.arrow_forward
- A random sample of 10 subjects have weights with a standard deviation of 11.9848 kg . What is the variance of their weights ? Be sure to include the appropriate units with the result .arrow_forwardA new material will replace the old material only if there is significant evidence that the mean strength of the new material is more than 2 units higher than the mean strength of the old material. Sample from new material: mean is 98.064 , SD is 5.6 and sample size is 13 Sample from old material: mean is 95.282 , SD is 5.8 and sample size is 78 We do not know population standard deviations. Consider the test ?0:????−????=2H0:μnew−μold=2 vs. ?0:????−????>2H0:μnew−μold>2 What is the p-value? (Hint: best to use software, or else the Desmos Calculator for the 2 sample T and Z test) Give as a decimal between 0 and 1 accurate to at least 4 decimal places.arrow_forwardThe mean age of 31 slot mechanic player is 51.3 years, and the standard deviation is 6.8 years.the mean age of a different sample of 35 roulette player is 54.8 year and standard deviation is 3.2 years. Can it be concluded at alpha = 0.01 that the mean age of slot machine players is less than those players roulette? Assume the variance are equal Step 1= Step 2= Step 3= Step 4=arrow_forward
- 2. A pet association claims that the mean annual costs of food for dogs and cats are the same. The results for samples of the two types of pets are shown in the following table. On wished to test the claim. Assume both populations follow normal distributions Dogs Cats 21 - 16 T1= 239 n2 = 18 Iz= 203 S1 = 32 82 =28 with equal variances. Which of the following formula should be used to calculate the standardized test statistic? (a) Z = (21-32)- Do lu A n2 = (E1-2)-Do (b) Z V n1+2 (c) T (1-2)-Do (21-1)a7+(n2-1)s I1 11+11タ-3 V 1'n2 (d) T = d- Do sp/Vn (e) Zarrow_forwardParamesan cheese is aged for an average of 24 months to allow it to develop the desire richness in flavor the standard deviation for the length of time Parmesan cheese is aged is 3.7 months How long would Parmesan cheese have to be aged in order to be in the 90th percentile? Assume that the data is normally distributedarrow_forward
arrow_back_ios
arrow_forward_ios
Recommended textbooks for you
- MATLAB: An Introduction with ApplicationsStatisticsISBN:9781119256830Author:Amos GilatPublisher:John Wiley & Sons Inc
 Probability and Statistics for Engineering and th...StatisticsISBN:9781305251809Author:Jay L. DevorePublisher:Cengage Learning
 Statistics for The Behavioral Sciences (MindTap C...StatisticsISBN:9781305504912Author:Frederick J Gravetter, Larry B. WallnauPublisher:Cengage Learning
  Elementary Statistics: Picturing the World (7th E...StatisticsISBN:9780134683416Author:Ron Larson, Betsy FarberPublisher:PEARSON
 The Basic Practice of StatisticsStatisticsISBN:9781319042578Author:David S. Moore, William I. Notz, Michael A. FlignerPublisher:W. H. Freeman
 Introduction to the Practice of StatisticsStatisticsISBN:9781319013387Author:David S. Moore, George P. McCabe, Bruce A. CraigPublisher:W. H. Freeman
MATLAB: An Introduction with Applications
Statistics
ISBN:9781119256830
Author:Amos Gilat
Publisher:John Wiley & Sons Inc
Probability and Statistics for Engineering and th...
Statistics
ISBN:9781305251809
Author:Jay L. Devore
Publisher:Cengage Learning
Statistics for The Behavioral Sciences (MindTap C...
Statistics
ISBN:9781305504912
Author:Frederick J Gravetter, Larry B. Wallnau
Publisher:Cengage Learning
Elementary Statistics: Picturing the World (7th E...
Statistics
ISBN:9780134683416
Author:Ron Larson, Betsy Farber
Publisher:PEARSON
The Basic Practice of Statistics
Statistics
ISBN:9781319042578
Author:David S. Moore, William I. Notz, Michael A. Fligner
Publisher:W. H. Freeman
Introduction to the Practice of Statistics
Statistics
ISBN:9781319013387
Author:David S. Moore, George P. McCabe, Bruce A. Craig
Publisher:W. H. Freeman