
MATLAB: An Introduction with Applications
6th Edition
ISBN: 9781119256830
Author: Amos Gilat
Publisher: John Wiley & Sons Inc
expand_more
expand_more
format_list_bulleted
Related questions
Question
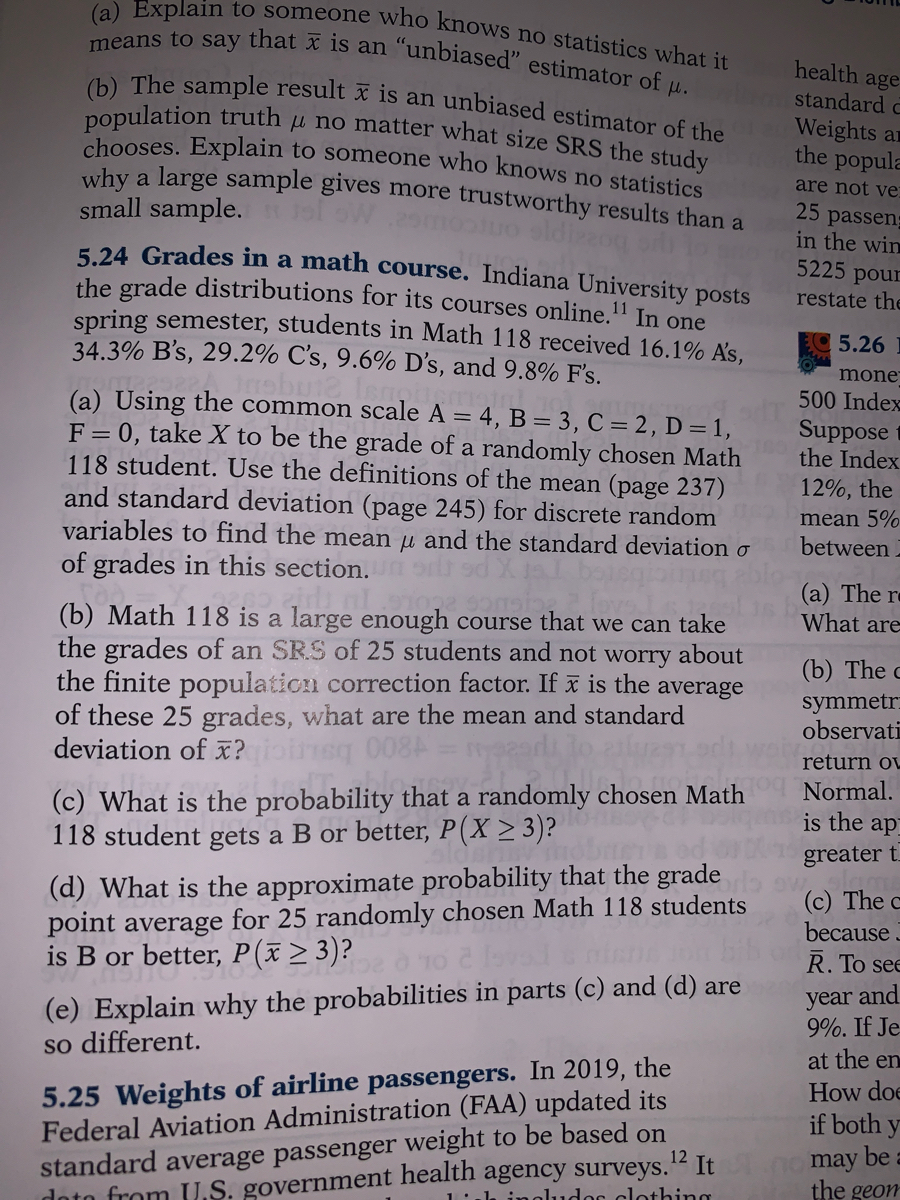

Transcribed Image Text:(a) Explain to someone who knows no statistics what it
means to say that x is an "unbiased" estimator of .
(b) The sample result x is an unbiased estimator of the
population truth u no matter what size SRS the study
chooses. Explain to someone who knows no statistics
health age
standard a
Weights an
the popula
why a large sample gives more trustworthy results than a
small sample.
are not ve:
25 passen;
in the win
5225 pour
5 24 Grades in a math course. Indiana University posts
the grade distributions for its courses online." In one
spring semester, students in Math 118 received 16.1% A's,
34.3% B's, 29.2% C's, 9.6% D's, and 9.8% F's.
restate the
5.26
monej
500 Index
(a) Using the common scale A = 4, B = 3, C = 2, D = 1,
F = 0, take X to be the grade of a randomly chosen Math
118 student. Use the definitions of the mean (page 237)
and standard deviation (page 245) for discrete random
variables to find the mean µ and the standard deviation o
of grades in this section.
Suppose
the Index
12%, the
mean 5%
between
(a) The re
What are
(b) Math 118 is a large enough course that we can take
the grades of an SR.S of 25 students and not worry about
the finite populaticn correction factor. If x is the average
of these 25 grades, what are the mean and standard
deviation of x?
(b) The c
symmetr:
observati
pinsq 0084
return ov
(c) What is the probability that a randomly chosen Math
118 student gets a B or better, P(X > 3)?
Normal.
is the ap
greater t.
(d) What is the approximate probability that the grade
point average for 25 randomly chosen Math 118 students
is B or better, P(ã>3)?
(c) The c
because
R. To see
(e) Explain why the probabilities in parts (c) and (d) are
so different.
year and
9%. If Je
at the en
5.25 Weights of airline passengers. In 2019, the
Federal Aviation Administration (FAA) updated its
How doe
if both y
standard average passenger weight to be based on
doto from U.S. government health agency surveys.2 It
1'h ingludor clothing
no may be a
the geom
Expert Solution
This question has been solved!
Explore an expertly crafted, step-by-step solution for a thorough understanding of key concepts.

This is a popular solution

Trending nowThis is a popular solution!

Step by stepSolved in 4 steps

Knowledge Booster

Similar questions
- q3- For categorical data: Select one or more: a. We can't apply boxplot to show its distribution b. We can apply aggregate functions. c. We can't use histogram to show its distribution. d. The interval between units is the same.arrow_forwardIn the US, 43.9% of all people have type O blood, 40.6% have type A blood, 10.8% have type B blood and 4.7% have type AB blood. A researcher wants to see if the distribution of blood type is different for millionaires. The table below shows the results of a random sample of 3488 millionaires. What can be concluded at the a = 0.05 significance level? a. Complete the table by filling in the expected frequencies. Round to the nearest whole number: Frequencies of Blood Type Outcome Frequency Expected Frequency 1521 A 1427 В 376 АВ 164arrow_forwardThe accompanying data represent the miles per gallon of a random sample of cars with a three cylinder 1.0 liter enginearrow_forward
- The football coach randomly selected fifteen players and timed how long each player took to perform a certain drill. The times (in minutes) were: 3.5, 3.3, 3.2, 4.7, 4.4, 3.5, 3.9, 4.5, 4.8, 5.2, 5.4, 4.0, 4.3, 4.1, 5.1 (a) Show that this data approximates a normal distribution. (b) Determine a 90% confidence interval for the mean time for all players.arrow_forwardThe length of fish were measured at 3 different lakes. Lake 1: 3.5, 4.2, 6.1, 5.2 Lake 2: 5.1, 6.2, 5.3, 2.1 Lake 3: 5.6, 7.1, 2.4, 4.1, 6.2 Enter the test statistic (to 4 decimal places)arrow_forwardEspañol A r.able indicator of a baby's health is the weight gained in the fir year of the baby's life. Assume that the population of all such weight gains for baby boys is approximately normally distributed. A study claimed that the mean of this population is 3.454 kg. As a practicing pediatrician, you want to test this claim. So, you select a random sample of baby boys, and you record the weight each gained in their first year. Follow the steps below to construct a 95% confidence interval for the population mean of all the weight gains for baby boys in their first year. Then state whether the confidence interval you construct contradicts the study's claim. (If necessary, consult a list of formulas.) (a) Click on "Take Sample" to see the results for your random sample. Take Sample Sample size: 0 Point estimate: 0 Sample standard deviation: 0 Critical value: 0 Enter the values of the sample size, the point estimate of the mean, the sample standard deviation, and the critical value you…arrow_forward
- I'm looking for help on the first 3 bullet points please.arrow_forwardWhat provides a measure of the variance caused by random, unsystematic differences? a. the error term b. the F ratio c. MS d. SStotalarrow_forwardDuring final exam week, Mary had exams in psychology, art history, and biology. All three distributions had normal distributions. On which test did Mary do best, relative to her classmates? On which test did she do worst? Psychology Art History Biology Mean 84 37 123 SD 14 8 12 Mary’s Score 90 45 145arrow_forward
arrow_back_ios
arrow_forward_ios
Recommended textbooks for you
- MATLAB: An Introduction with ApplicationsStatisticsISBN:9781119256830Author:Amos GilatPublisher:John Wiley & Sons Inc
 Probability and Statistics for Engineering and th...StatisticsISBN:9781305251809Author:Jay L. DevorePublisher:Cengage Learning
 Statistics for The Behavioral Sciences (MindTap C...StatisticsISBN:9781305504912Author:Frederick J Gravetter, Larry B. WallnauPublisher:Cengage Learning
  Elementary Statistics: Picturing the World (7th E...StatisticsISBN:9780134683416Author:Ron Larson, Betsy FarberPublisher:PEARSON
 The Basic Practice of StatisticsStatisticsISBN:9781319042578Author:David S. Moore, William I. Notz, Michael A. FlignerPublisher:W. H. Freeman
 Introduction to the Practice of StatisticsStatisticsISBN:9781319013387Author:David S. Moore, George P. McCabe, Bruce A. CraigPublisher:W. H. Freeman
MATLAB: An Introduction with Applications
Statistics
ISBN:9781119256830
Author:Amos Gilat
Publisher:John Wiley & Sons Inc
Probability and Statistics for Engineering and th...
Statistics
ISBN:9781305251809
Author:Jay L. Devore
Publisher:Cengage Learning
Statistics for The Behavioral Sciences (MindTap C...
Statistics
ISBN:9781305504912
Author:Frederick J Gravetter, Larry B. Wallnau
Publisher:Cengage Learning
Elementary Statistics: Picturing the World (7th E...
Statistics
ISBN:9780134683416
Author:Ron Larson, Betsy Farber
Publisher:PEARSON
The Basic Practice of Statistics
Statistics
ISBN:9781319042578
Author:David S. Moore, William I. Notz, Michael A. Fligner
Publisher:W. H. Freeman
Introduction to the Practice of Statistics
Statistics
ISBN:9781319013387
Author:David S. Moore, George P. McCabe, Bruce A. Craig
Publisher:W. H. Freeman