Question
How do you solve this?

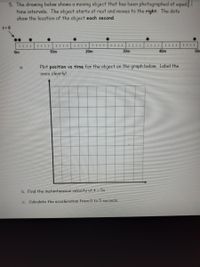
Transcribed Image Text:5. The drawing below shows a moving object that has been photographed at equal 1
time intervals. The object starts at rest and moves to the right. The dots
show the location of the object each second.
t 0
I|||||||
Om
10m
20m
30m
40m
50m
Plot position vs time for the object on the graph below. Label the
axes clearly!
a.
b. Find the instantaneous velocity at t = 5s
c. Calculate the acceleration from 0 to 5 seconds.

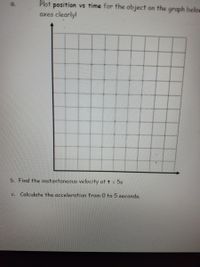
Transcribed Image Text:Plot position vs time for the object on the graph below
axes clearly!
a.
b. Find the instantaneous velocity at t = 5s
Calculate the acceleration from 0 to 5 seconds.
Expert Solution
This question has been solved!
Explore an expertly crafted, step-by-step solution for a thorough understanding of key concepts.
This is a popular solution
Trending nowThis is a popular solution!
Step by stepSolved in 4 steps

Knowledge Booster
Similar questions
arrow_back_ios
SEE MORE QUESTIONS
arrow_forward_ios