
Database System Concepts
7th Edition
ISBN: 9780078022159
Author: Abraham Silberschatz Professor, Henry F. Korth, S. Sudarshan
Publisher: McGraw-Hill Education
expand_more
expand_more
format_list_bulleted
Related questions
Concept explainers
Question
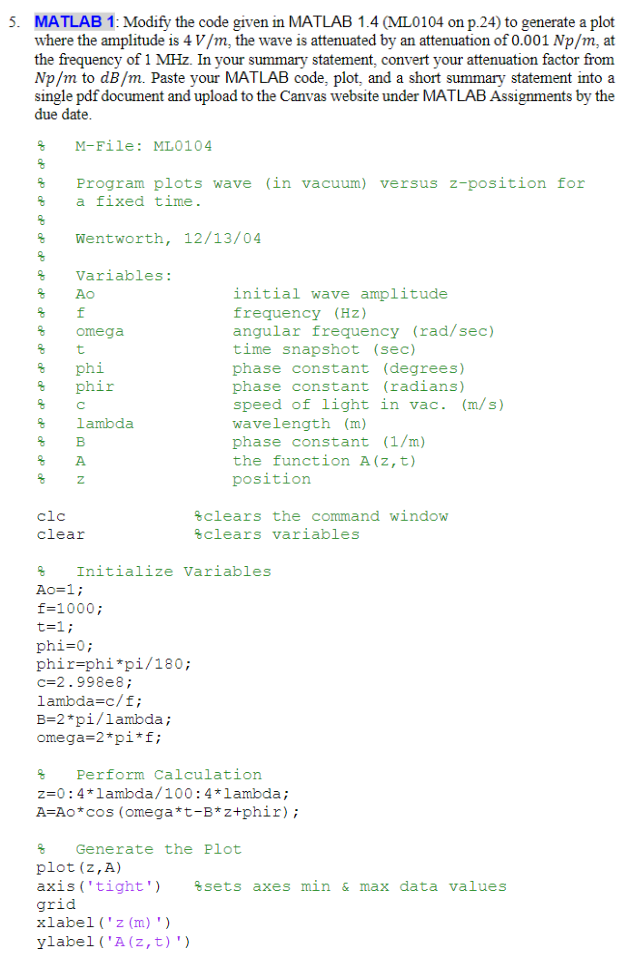

Transcribed Image Text:5. MATLAB 1: Modify the code given in MATLAB 1.4 (ML0104 on p.24) to generate a plot
where the amplitude is 4 V/m, the wave is attenuated by an attenuation of 0.001 Np/m, at
the frequency of 1 MHz. In your summary statement, convert your attenuation factor from
Np/m to dB/m. Paste your MATLAB code, plot, and a short summary statement into a
single pdf document and upload to the Canvas website under MATLAB Assignments by the
due date.
g
8
8
op do
g
z
g
8
8
8
8
8
8
do do
z
M-File: ML0104
Program plots wave (in vacuum) versus z-position for
a fixed time.
Wentworth, 12/13/04
Variables:
Ao
f
omega
t
phi
phir
с
lambda
응
BAN
A
clc
clear
8
Ao=1;
f=1000;
t=1;
phi=0;
phir-phi*pi/180;
c=2.998e8;
lambda=c/f;
Initialize Variables
B=2*pi/lambda;
omega=2*pi*f;
initial wave amplitude
frequency (Hz)
angular frequency (rad/sec)
time snapshot (sec)
phase constant (degrees)
phase constant (radians)
speed of light in vac. (m/s)
wavelength (m)
phase constant (1/m)
the function A(z, t)
position
8
plot (z, A)
axis ('tight')
grid
clears the command window
clears variables
Perform Calculation
z=0:4*lambda/100:4*lambda;
A=Ao*cos (omega*t-B* z+phir);
xlabel('z(m)')
ylabel ('A (z, t)')
Generate the Plot
sets axes min & max data values
Expert Solution
This question has been solved!
Explore an expertly crafted, step-by-step solution for a thorough understanding of key concepts.

Step by stepSolved in 3 steps with 2 images

Knowledge Booster


Learn more about
Need a deep-dive on the concept behind this application? Look no further. Learn more about this topic, computer-science and related others by exploring similar questions and additional content below.Similar questions
- Problem 2 You are studying the temperature and pressure of the atmosphere at various altitudes and want to correlate your collected data with NASA. Write a Matlab program that takes an input from the user for altitude (H) in meters. Use this input to determine and print the region of the atmosphere, temperature (T) [°C], and pressure (P) [kPa] using the NASA model. If the input altitude is outside of the ranges below, the program should print an error message and terminate. Trophosphere • Altitude: < 11000 • Temperature: T 15.04 - 0.00649 T+273.1 5.256 • Pressure: P = 101.29 288.08 Lower Stratosphere • Altitude: 11000 < H < 25000 • Temperature: T = -56.46 • Pressure: P = 22.65e 1.73-0.000157H Upper Stratosphere • Altitude: 25000arrow_forwardWrite a Matlab function that returns the value of "y" for a given value of "x" and "N": y = N Σ n=0 ⚫ function name: "exam1" ⚫ function input variables: "x" and "N" ⚫ you MUST use a for-looparrow_forward5. Write a MATLAB program to plot the autocorrelation of the given sequence signal and attach the source code as well as output. inpSignal =[1 2 3 4 5 6 7]arrow_forward
- Write MATLAB code that will plot the function x² - 10x + 25 over the x values 0 to 10 on a regular plot (use the command plot) using 21 evenly spaced points with the linspace command in one subplot and then for the second subplot, plot the same function over the x values 10-¹ to 10 ¹ using 21 evenly spaced points on a semi logarithmic plot (use the command semilogx). Put markers on each point used in the calculations (using a circle, x, or +, your choice) using a different marker and color for each plot, and include axis labels on each subplot. If the code is written correctly, your subplots should appear like the ones below. 25 y-axis 20 15 10 X 5 0 0 2 4 x-axis 6 8 10 25 PO 20 y-axis 15 10 5 0 10-1 O Copy/paste your code that will create the subplots in the text box below. 0 0 0 0 0 0 0 10⁰ x-axis 0 0 0 0 0 10¹arrow_forwardIn MATLAB: Write a program to plot an image and it's histogram. Take the address of image as: xyz.jpg Please attach a correct code so that I can run it with my image on my system.arrow_forward
arrow_back_ios
arrow_forward_ios
Recommended textbooks for you
- Database System ConceptsComputer ScienceISBN:9780078022159Author:Abraham Silberschatz Professor, Henry F. Korth, S. SudarshanPublisher:McGraw-Hill Education
 Starting Out with Python (4th Edition)Computer ScienceISBN:9780134444321Author:Tony GaddisPublisher:PEARSON
 Digital Fundamentals (11th Edition)Computer ScienceISBN:9780132737968Author:Thomas L. FloydPublisher:PEARSON
  C How to Program (8th Edition)Computer ScienceISBN:9780133976892Author:Paul J. Deitel, Harvey DeitelPublisher:PEARSON
 Database Systems: Design, Implementation, & Manag...Computer ScienceISBN:9781337627900Author:Carlos Coronel, Steven MorrisPublisher:Cengage Learning
 Programmable Logic ControllersComputer ScienceISBN:9780073373843Author:Frank D. PetruzellaPublisher:McGraw-Hill Education
Database System Concepts
Computer Science
ISBN:9780078022159
Author:Abraham Silberschatz Professor, Henry F. Korth, S. Sudarshan
Publisher:McGraw-Hill Education
Starting Out with Python (4th Edition)
Computer Science
ISBN:9780134444321
Author:Tony Gaddis
Publisher:PEARSON
Digital Fundamentals (11th Edition)
Computer Science
ISBN:9780132737968
Author:Thomas L. Floyd
Publisher:PEARSON
C How to Program (8th Edition)
Computer Science
ISBN:9780133976892
Author:Paul J. Deitel, Harvey Deitel
Publisher:PEARSON
Database Systems: Design, Implementation, & Manag...
Computer Science
ISBN:9781337627900
Author:Carlos Coronel, Steven Morris
Publisher:Cengage Learning
Programmable Logic Controllers
Computer Science
ISBN:9780073373843
Author:Frank D. Petruzella
Publisher:McGraw-Hill Education