
MATLAB: An Introduction with Applications
6th Edition
ISBN: 9781119256830
Author: Amos Gilat
Publisher: John Wiley & Sons Inc
expand_more
expand_more
format_list_bulleted
Related questions
Question
In your population with a sex ratio of 30% males and 70% females what are the expected percentages in your paired wise sampling of the following?
mm?
Mf?
Fm?
Ff?

Transcribed Image Text:2.
3
4
5.
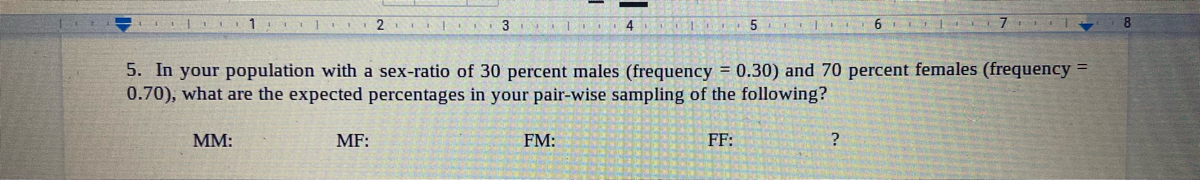
5. In your population with a sex-ratio of 30 percent males (frequency = 0.30) and 70 percent females (frequency =
0.70), what are the expected percentages in your pair-wise sampling of the following?
MM:
MF:
FM:
FF:
Expert Solution
This question has been solved!
Explore an expertly crafted, step-by-step solution for a thorough understanding of key concepts.

This is a popular solution

Trending nowThis is a popular solution!

Step by stepSolved in 2 steps

Knowledge Booster

Similar questions
- A study was done to look at the relationship between number of lovers college students have had in their lifetimes and their GPAs. The results of the survey are shown below. Lovers 4 8 3 7 0 6 5 6 GPA 2.7 2.3 3.4 2.4 3.5 2.9 2.7 2.8 r2r2 = (Round to two decimal places) Interpret r2r2 : There is a large variation in students' GPAs, but if you only look at students who have had a fixed number of lovers, this variation on average is reduced by 80%. Given any group of students who have all had the same number of lovers, 80% of all of these studetns will have the predicted GPA. 80% of all students will have the average GPA. There is a 80% chance that the regression line will be a good predictor for GPA based on the number of lovers a student has had. The equation of the linear regression line is: ˆyy^ = + xx (Please show your answers to two decimal places) Use the model to predict the GPA of a college student who as had 7 lovers.GPA = (Please round your…arrow_forwardIdentify the kind of sample that is described. An electronics store polls 300 customers who bought computers at the store within the past two years about high-speed Internet rates. The sample consisted of 150 randomly selected Mac users and 150 randomly selecțed PC users. The sample is a (Choose one) v sample. convenience simple random cluster voluntary response stratified systematicarrow_forwardStep 2 of 2 : Given the following parameters for a sampling distribution of sample proportions, calculate the standard score of the sample proportion. Round your answer to two decimal places. p=0.65, x=142, n=200arrow_forward
- The ages for a sample of fans at a concert are listed. Whats the mean, median, mode, range, variance, standard deviation, and coefficient of variation?arrow_forwardAnswer asaparrow_forwardConsider a sample with data values of 27, 25, 20, 15, 30, 34, 28, and 25. Compute the 19th, 24th, 65th, and 75th percentiles. If needed, round your answers to two decimal digits. Percentile Value 19% 24% 65% 75%arrow_forward
- The following are the GPAs of 18 r/s SCC students:1.3, 1.5, 1.7, 2.2, 2.5, 2.6, 2.6, 2.6, 2.6, 2.8, 2.9, 2.9, 3.0, 3.1, 3.5, 3.5, 3.6, 3.9(a) Find the 70th percentile of the data.(b) Find the median and Q1and Q3Make sure you properly justify how to find them.(c)Find all outliers using the IQR method d) Draw the box plot of this dataarrow_forwardA survey of 2,510 golfers showed that 311 of them are left-handed. Find a point estimate for p, the population proportion of golfers that are left-handed. A. 0.11 B. 0.124 C. 0.141 D. 0.876arrow_forwardA group of students were surveyed about the number of siblings they have. Their responses are summarized in the frequency table below. How many students responded to the survey? Number of Siblings Frequency 0 6 1 8 2 5 3 3 4 1 5 or more 3arrow_forward
arrow_back_ios
arrow_forward_ios
Recommended textbooks for you
- MATLAB: An Introduction with ApplicationsStatisticsISBN:9781119256830Author:Amos GilatPublisher:John Wiley & Sons Inc
 Probability and Statistics for Engineering and th...StatisticsISBN:9781305251809Author:Jay L. DevorePublisher:Cengage Learning
 Statistics for The Behavioral Sciences (MindTap C...StatisticsISBN:9781305504912Author:Frederick J Gravetter, Larry B. WallnauPublisher:Cengage Learning
  Elementary Statistics: Picturing the World (7th E...StatisticsISBN:9780134683416Author:Ron Larson, Betsy FarberPublisher:PEARSON
 The Basic Practice of StatisticsStatisticsISBN:9781319042578Author:David S. Moore, William I. Notz, Michael A. FlignerPublisher:W. H. Freeman
 Introduction to the Practice of StatisticsStatisticsISBN:9781319013387Author:David S. Moore, George P. McCabe, Bruce A. CraigPublisher:W. H. Freeman
MATLAB: An Introduction with Applications
Statistics
ISBN:9781119256830
Author:Amos Gilat
Publisher:John Wiley & Sons Inc
Probability and Statistics for Engineering and th...
Statistics
ISBN:9781305251809
Author:Jay L. Devore
Publisher:Cengage Learning
Statistics for The Behavioral Sciences (MindTap C...
Statistics
ISBN:9781305504912
Author:Frederick J Gravetter, Larry B. Wallnau
Publisher:Cengage Learning
Elementary Statistics: Picturing the World (7th E...
Statistics
ISBN:9780134683416
Author:Ron Larson, Betsy Farber
Publisher:PEARSON
The Basic Practice of Statistics
Statistics
ISBN:9781319042578
Author:David S. Moore, William I. Notz, Michael A. Fligner
Publisher:W. H. Freeman
Introduction to the Practice of Statistics
Statistics
ISBN:9781319013387
Author:David S. Moore, George P. McCabe, Bruce A. Craig
Publisher:W. H. Freeman