
MATLAB: An Introduction with Applications
6th Edition
ISBN: 9781119256830
Author: Amos Gilat
Publisher: John Wiley & Sons Inc
expand_more
expand_more
format_list_bulleted
Related questions
Concept explainers
Question
i need Part 5,6,7 Solution just

Transcribed Image Text:Exercise 2.
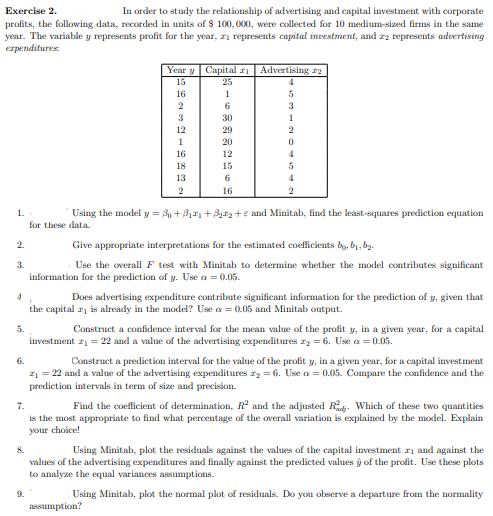
In order to study the relationship of advertising and capital investment with corporate
profits, the following data, recorded in units of $ 100, 000, were collected for 10 medium-sized firms in the same
year. The variable y represents profit for the year, ri represents capilal investment, and rz represents advertising
expenditures:
Year y Capital ri
Advertising ra
15
25
16
1
2
6
3
30
1
12
29
1
20
16
12
18
15
13
6
16
2
Using the model y = Bo +B11 +Br2+e and Minitab, find the least-squares prediction equation
1.
for these data.
2.
Give appropriate interpretations for the estimated coeflicients by, b1, b2.
3.
Use the overall F test with Minitab to determine whether the model contributes significant
information for the prediction of y. Use a = 0.05.
Does advertising expenditure contribute significant information for the prediction of y, given that
the capital r, is already in the model? Use a = 0.05 and Minitab output.
5.
Construct a confidence interval for the mean value of the profit y, in a given year, for a capital
investment z = 22 and a value of the advertising expenditures z2 = 6. Use a = 0.05.
6.
Construct a prediction interval for the value of the profit y, in a given year, for a capital investment
n = 22 and a value of the advertising expenditures r2 = 6. Use a = 0.05. Compare the confidence and the
prediction intervals in term of size and precision.
7.
Find the coefficient of determination, R and the adjusted R. Which of these two quantities
is the most appropriate to find what percentage of the overall variation is explained by the model. Explain
your choice!
8.
Using Minitab, plot the residuals against the values of the capital investment ri and against the
values of the advertising expenditures and finally against the predicted values y of the profit. Use these plots
to analyze the equal variances assumptions.
9.
Using Minitab, plot the normal plot of residuals. Do you observe a departure from the normality
assumption?
Expert Solution
This question has been solved!
Explore an expertly crafted, step-by-step solution for a thorough understanding of key concepts.

Step by stepSolved in 2 steps with 1 images

Knowledge Booster


Learn more about
Need a deep-dive on the concept behind this application? Look no further. Learn more about this topic, statistics and related others by exploring similar questions and additional content below.Similar questions
- 8) I have a small dog and a big dog. My big dog weighs 50 pounds more than twice the weight of my small dog. The sum of their weights is 68 pounds. How much do they weigh?arrow_forwardHow do I solvearrow_forwardYou are designing a poster which has a border around the printed portion. The border is 2 inches wide on the left and right sides, and 3 inches wide on the top and bottom. The entire poster will be a total of 300 square inches, including the borders and printed portion combined.arrow_forward
arrow_back_ios
arrow_forward_ios
Recommended textbooks for you
- MATLAB: An Introduction with ApplicationsStatisticsISBN:9781119256830Author:Amos GilatPublisher:John Wiley & Sons Inc
 Probability and Statistics for Engineering and th...StatisticsISBN:9781305251809Author:Jay L. DevorePublisher:Cengage Learning
 Statistics for The Behavioral Sciences (MindTap C...StatisticsISBN:9781305504912Author:Frederick J Gravetter, Larry B. WallnauPublisher:Cengage Learning
  Elementary Statistics: Picturing the World (7th E...StatisticsISBN:9780134683416Author:Ron Larson, Betsy FarberPublisher:PEARSON
 The Basic Practice of StatisticsStatisticsISBN:9781319042578Author:David S. Moore, William I. Notz, Michael A. FlignerPublisher:W. H. Freeman
 Introduction to the Practice of StatisticsStatisticsISBN:9781319013387Author:David S. Moore, George P. McCabe, Bruce A. CraigPublisher:W. H. Freeman
MATLAB: An Introduction with Applications
Statistics
ISBN:9781119256830
Author:Amos Gilat
Publisher:John Wiley & Sons Inc
Probability and Statistics for Engineering and th...
Statistics
ISBN:9781305251809
Author:Jay L. Devore
Publisher:Cengage Learning
Statistics for The Behavioral Sciences (MindTap C...
Statistics
ISBN:9781305504912
Author:Frederick J Gravetter, Larry B. Wallnau
Publisher:Cengage Learning
Elementary Statistics: Picturing the World (7th E...
Statistics
ISBN:9780134683416
Author:Ron Larson, Betsy Farber
Publisher:PEARSON
The Basic Practice of Statistics
Statistics
ISBN:9781319042578
Author:David S. Moore, William I. Notz, Michael A. Fligner
Publisher:W. H. Freeman
Introduction to the Practice of Statistics
Statistics
ISBN:9781319013387
Author:David S. Moore, George P. McCabe, Bruce A. Craig
Publisher:W. H. Freeman