
MATLAB: An Introduction with Applications
6th Edition
ISBN: 9781119256830
Author: Amos Gilat
Publisher: John Wiley & Sons Inc
expand_more
expand_more
format_list_bulleted
Related questions
Question

Transcribed Image Text:**Educational Website Content: Statistical Analysis Exercise**
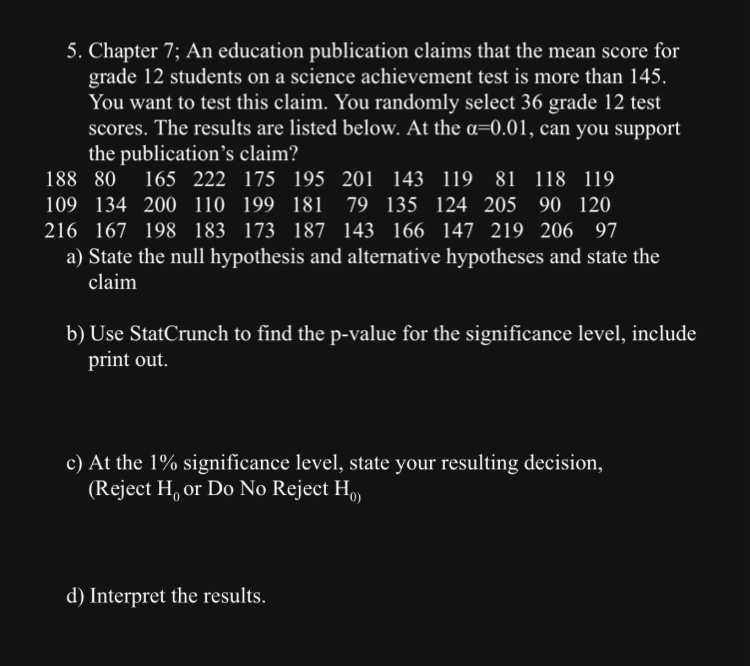
**Chapter 7: Hypothesis Testing for Science Achievement Scores**
**Background:**
An educational publication claims that the mean score for grade 12 students on a science achievement test is more than 145. To test this claim, a random sample of 36 grade 12 test scores has been selected. The scores are as follows:
188, 80, 165, 222, 175, 195, 201, 143, 119, 81, 118, 119,
109, 134, 200, 110, 199, 181, 79, 135, 124, 205, 90, 120,
216, 167, 198, 183, 173, 187, 143, 166, 147, 219, 206, 97
The test is conducted at a 1% significance level (α = 0.01).
**Tasks:**
a) **State the Hypotheses:**
- **Null Hypothesis (H₀):** µ ≤ 145
- **Alternative Hypothesis (H₁):** µ > 145
b) **Calculate the p-value:**
Use statistical software (StatCrunch) to compute the p-value associated with the test statistic. Include the software printout with your exercise submission.
c) **Decision at α = 0.01:**
Determine whether to reject or not reject the null hypothesis based on the calculated p-value.
d) **Interpretation:**
Provide an interpretation of the results in the context of the claim made by the publication.
**Note:** This exercise focuses on hypothesis testing and requires critical analysis of statistical outputs to make informed decisions regarding the claim.
Expert Solution
This question has been solved!
Explore an expertly crafted, step-by-step solution for a thorough understanding of key concepts.

This is a popular solution

Trending nowThis is a popular solution!

Step by stepSolved in 2 steps with 9 images

Knowledge Booster

Similar questions
- 4. The following are the scores of the male and female students in Statistics. Determine whether the male students perform better in the subject than the female students. Use 0.05 level of confidence. Males 32 25 44 26 25 37 30 25 65 27 22 15 52 X (g) Y (cm) X (g) Y (cm) 155 28 150 28 139 25 138 26 100 20 153 29 145 27 143 27 121 23 114 21 128 20 130 25 143 28 125 21 Females 5. The researcher wishes to find out the relationship between the weight and the length of fish cultured at the fishpond using bread meal as supplemental feed. Is there a significant degree of relationship between the weight and length of the fish? Use 0.05 level of confidence and answer the ff: 1. How much is the weight if it measures 30 cm? 2. How long is the fish if it weighs 120 g?arrow_forwardWhich of the following statements about in-control and out-of-control processes is (are) true? I. The mean chart and range chart always show that processes are in control. II. A mean chart can be in control, while a range chart can be out of control. III. A mean chart can be out of control, while a range chart can be in control A. I only B. II only C. II and III D. I and IIIarrow_forward1) The question screenshot attached down below answer all and just need final answerarrow_forward
- .arrow_forwardChapter 13 A researcher wants to determine whether there is a difference in the mean age of community college prófessors, publiC university professors, and private university professors. Professors from each were randomly selected across America and their ages were recorded. The data is given below. Test whether there is a difference in the mean ages. Find the P-Value. Community College Public University Private University 23 38 45 28 36 45 27 41 39 37 47 61 52 42 36 25 31 35 O 0.3571 O 0.2357 O 0.1142 O 0.2289arrow_forwardIn a city with three high schools, all the ninth graders took a Standardized Test, with these results: High School Mean score on test Number of ninth graders Glenwood 80 289 Central City 93 342 Lincoln High The city's PR manager, who never took statistics, claimed the mean score of all ninth graders in the city was 80. Of course, that is incorrect. What is the mean score for all ninth graders in the city? Round to one decimal place. 67 170 mean of all ninth grader's scores =arrow_forward
- In a city with three high schools, all the ninth graders took a Standardized Test, with these results: Number of ninth graders (Frequency) Mean Test Score High School Glenwood 82 262 Central 92 311 Lincoln 67 168 The city's PR manager, who never took statistics, claimed the mean score of all ninth graders in the city was the average of 82, 92, and 67, whic incorrect. What is the mean score for all ninth graders in the city? Round to one decimal place 80.3. Of course, that is Mean of all ninth grader's scores *arrow_forwardThe boxplot shown below results from the heights (cm) of males listed in a data set. What do the numbers in that boxplot tell us? 152 173.3 194 169.6 179.5 The minimum height is cm, the first quartile Q, is cm, the second quartile Q, (or the median) is cm, the third quartile Q, is cm, and the maximum height is cm. (Type integers or decimals. Do not round.) O Time MacBook Pro -> G Search or type URL esc ! %23 $ & 1 4 5 7 8 9 Q W R Y tab S F K caps lock C V shift fn comman control option commandarrow_forward
arrow_back_ios
arrow_forward_ios
Recommended textbooks for you
- MATLAB: An Introduction with ApplicationsStatisticsISBN:9781119256830Author:Amos GilatPublisher:John Wiley & Sons Inc
 Probability and Statistics for Engineering and th...StatisticsISBN:9781305251809Author:Jay L. DevorePublisher:Cengage Learning
 Statistics for The Behavioral Sciences (MindTap C...StatisticsISBN:9781305504912Author:Frederick J Gravetter, Larry B. WallnauPublisher:Cengage Learning
  Elementary Statistics: Picturing the World (7th E...StatisticsISBN:9780134683416Author:Ron Larson, Betsy FarberPublisher:PEARSON
 The Basic Practice of StatisticsStatisticsISBN:9781319042578Author:David S. Moore, William I. Notz, Michael A. FlignerPublisher:W. H. Freeman
 Introduction to the Practice of StatisticsStatisticsISBN:9781319013387Author:David S. Moore, George P. McCabe, Bruce A. CraigPublisher:W. H. Freeman
MATLAB: An Introduction with Applications
Statistics
ISBN:9781119256830
Author:Amos Gilat
Publisher:John Wiley & Sons Inc
Probability and Statistics for Engineering and th...
Statistics
ISBN:9781305251809
Author:Jay L. Devore
Publisher:Cengage Learning
Statistics for The Behavioral Sciences (MindTap C...
Statistics
ISBN:9781305504912
Author:Frederick J Gravetter, Larry B. Wallnau
Publisher:Cengage Learning
Elementary Statistics: Picturing the World (7th E...
Statistics
ISBN:9780134683416
Author:Ron Larson, Betsy Farber
Publisher:PEARSON
The Basic Practice of Statistics
Statistics
ISBN:9781319042578
Author:David S. Moore, William I. Notz, Michael A. Fligner
Publisher:W. H. Freeman
Introduction to the Practice of Statistics
Statistics
ISBN:9781319013387
Author:David S. Moore, George P. McCabe, Bruce A. Craig
Publisher:W. H. Freeman