
MATLAB: An Introduction with Applications
6th Edition
ISBN: 9781119256830
Author: Amos Gilat
Publisher: John Wiley & Sons Inc
expand_more
expand_more
format_list_bulleted
Related questions
Question
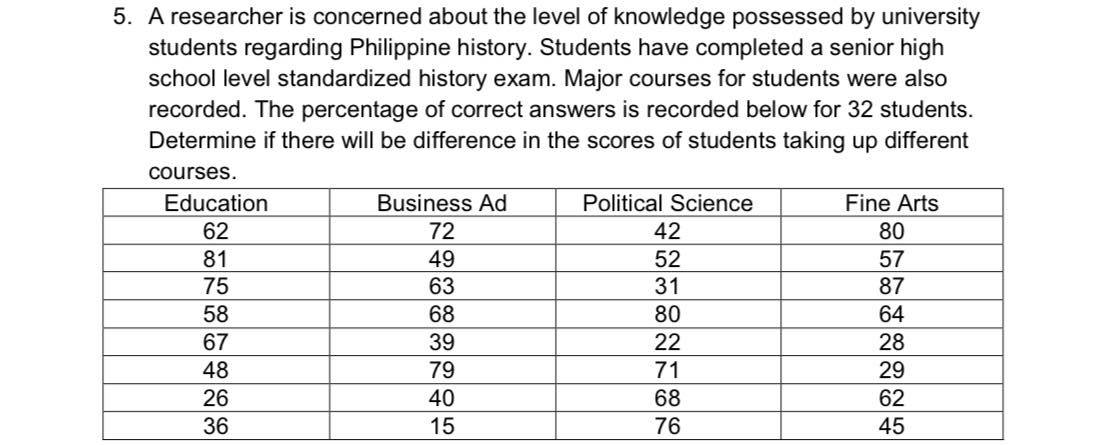
5. A researcher is concerned about the level of knowledge possessed by university students regarding Philippine history. Students have completed a senior high school level standardized history exam. Major courses for students were also recorded. The percentage of correct answers is recorded below for 32 students. Determine if there will be difference in the scores of students taking up different courses. Education Business Ad Political Science Fine Arts 62 72 42 81 49 63 52 57 75 31 87 58 68 80 64 67 39 22 28 48 79 71 29 26 40 68 62 36 15 76 45

Transcribed Image Text:5. A researcher is concerned about the level of knowledge possessed by university
students regarding Philippine history. Students have completed a senior high
school level standardized history exam. Major courses for students were also
recorded. The percentage of correct answers is recorded below for 32 students.
Determine if there will be difference in the scores of students taking up different
courses.
Education
Business Ad
Political Science
Fine Arts
62
72
42
81
49
63
52
57
75
31
87
58
68
80
64
67
39
22
28
48
79
71
29
26
40
68
62
36
15
76
45
Expert Solution
This question has been solved!
Explore an expertly crafted, step-by-step solution for a thorough understanding of key concepts.

This is a popular solution

Trending nowThis is a popular solution!

Step by stepSolved in 2 steps with 1 images

Knowledge Booster


Learn more about
Need a deep-dive on the concept behind this application? Look no further. Learn more about this topic, statistics and related others by exploring similar questions and additional content below.Similar questions
- The mean absolute deviation, or MAD, and the interquartile range, or IQR, are measures of variability. Measures of variability tell you how much the values in a data set tend to differ while a smaller measure of variability means that the data is more consistent and close to from one another. A greater measure of variability means that the data is more spread out Are you ready for more? LFind possible locations for the 6 pennies, Les Lesson 5 Summary the measure of center. To calculate the MAD of a data set: 1. Find the mean of the values in the data set. 2. Find the distance between each data value and the mean on the number line: |data value - mean| 3. Find the mean of the distances. This value is the MAD. To calculate the IQR, subtract the value of the first quartile from the value of the third quartile. Recall that the first and third quartile are included in the five number summary. 38 Student Workbook Algebraarrow_forwardObtain the five number summary for the given data. The test scores of 30 students are listed below. Find the five-number summary. 32 42 45 48 52 55 57 61 62 65 80 81 83 85 85 87 90 94 96 98 Send data to Excel O Min=32, Q, =61, Q,= 70, Q, = 83, Max = 98 Min = 32, Q, = 61, Q, = 72, Q,=83, Max = 98 O Min = 32, Q, = 59, Q, = 72, Q, = 83, Max = 98 O Min = 32, Q, = 59, Q, = 70, Q, = 83, Max = 98 Continuearrow_forward19. A high school math teacher summarized the 35 math SAT scores for the students in her calculau class. The mean for the class was 521 and themedian was 535. The range of the scores was 235 and the highest score in the entire class was 675. Approximately 40% of the lass scored higher than 562. State whether each of the following is true or false. a. The 45th percentile exceeds 540. b. The lowest score in the class was 440. c. The z-score for a score of 510 is a negative number. d. The third quartile exceeds 562. e. The percentile rank of 562 is 40.arrow_forward
- What percent of females thought that they were almost certain to be married in the next 10 years?arrow_forwardCan you do a histogram for Class 0-0.19, 0.20-0.39, 0.40-0.59, 0.60-0.79,0.80-0.99, 1.00-1.19, 1.20-1.39, Frequencies 25, 13, 5, 2, 2, 2, 3.arrow_forwardHere is a set of sample data. 43 75 64 40 50 11 91 99 44 82 39 25 35 86 60 2 27 83 45 65 1 93 88 10 Base on the data above, identify the 5 number summaryarrow_forward
- Are there any outliers?arrow_forwardIn a city with three high schools, all the ninth graders took a Standardized Test, with these results: High School Mean Test Score Number of ninth graders (Frequency) Glenwood 81 284 Central 95 323 Lincoln 69 154 The city's PR manager, who never took statistics, claimed the mean score of all ninth graders in the city was the average of 81, 95, and 69, which is 81.7. Of course, that is incorrect. What is the mean score for all ninth graders in the city? Round to one decimal place. mean of all ninth grader's scores =arrow_forward5. Which set of four test scores would have the biggest difference between the mean and the median? O A. 32, 85, 89, 91, 92, 92 O B. 72, 78, 79, 80, 82, 82 O C. 65, 70, 75, 80, 85, 90 O D. 30, 34, 39, 41, 48, 50arrow_forward
- 1. Identify whether the numbers are statistics or parameters. a. Of all US third grade teachers, 32% say that knowing cursive writing is an essential skill. b. Of the 500 US third grade teachers polled, 34% say that knowing cursive writing is an essential skill.arrow_forwardPlease see below. I need this asap please and thank you.arrow_forward1. The first decile is the A. 2nd quartile 2. It divides the data into a lower half and an upper half. C. 50th percentile D. 4th quartile B. 10th percentile A. Median B. Upper Quartile C. Lower Quartile D. Upper Decile 3. Find the median of the following numbers. 12, 5, 22, 30, 7, 36, 14, 42, 15, 53, 25 A. 36 В. 30 С. 22 D. 15 4. Which percentile is equivalent to the first quartile? A. 25th В. 50th C. 75th D. 100th 5. Which percentile is equivalent to the 5th decile? A. 25th В. 50th C. 75th D. 100th 6. Which measures of position divides the data into 4 parts? A. decile B. quartile C. percentile D. median 7. The following values are the ages of 15 students in a statistics class: 18 18 19 21 21 21 21 23 23 24 24 25 26 27 28 What is the 25th percentile? A. 18 В. 23 С. 21 D. 24 For items 8 to 11, consider the score distribution of 20 students given below 53 74 82 42 39 20 81 68 58 28 67 54 93 70 30 55 36 37 29 61 8. What is the lower quartile score? В. 30.25 A. 29.25 C. 36.25 D. 37.25 9.…arrow_forward
arrow_back_ios
arrow_forward_ios
Recommended textbooks for you
- MATLAB: An Introduction with ApplicationsStatisticsISBN:9781119256830Author:Amos GilatPublisher:John Wiley & Sons Inc
 Probability and Statistics for Engineering and th...StatisticsISBN:9781305251809Author:Jay L. DevorePublisher:Cengage Learning
 Statistics for The Behavioral Sciences (MindTap C...StatisticsISBN:9781305504912Author:Frederick J Gravetter, Larry B. WallnauPublisher:Cengage Learning
  Elementary Statistics: Picturing the World (7th E...StatisticsISBN:9780134683416Author:Ron Larson, Betsy FarberPublisher:PEARSON
 The Basic Practice of StatisticsStatisticsISBN:9781319042578Author:David S. Moore, William I. Notz, Michael A. FlignerPublisher:W. H. Freeman
 Introduction to the Practice of StatisticsStatisticsISBN:9781319013387Author:David S. Moore, George P. McCabe, Bruce A. CraigPublisher:W. H. Freeman
MATLAB: An Introduction with Applications
Statistics
ISBN:9781119256830
Author:Amos Gilat
Publisher:John Wiley & Sons Inc
Probability and Statistics for Engineering and th...
Statistics
ISBN:9781305251809
Author:Jay L. Devore
Publisher:Cengage Learning
Statistics for The Behavioral Sciences (MindTap C...
Statistics
ISBN:9781305504912
Author:Frederick J Gravetter, Larry B. Wallnau
Publisher:Cengage Learning
Elementary Statistics: Picturing the World (7th E...
Statistics
ISBN:9780134683416
Author:Ron Larson, Betsy Farber
Publisher:PEARSON
The Basic Practice of Statistics
Statistics
ISBN:9781319042578
Author:David S. Moore, William I. Notz, Michael A. Fligner
Publisher:W. H. Freeman
Introduction to the Practice of Statistics
Statistics
ISBN:9781319013387
Author:David S. Moore, George P. McCabe, Bruce A. Craig
Publisher:W. H. Freeman