ENGR.ECONOMIC ANALYSIS
14th Edition
ISBN: 9780190931919
Author: NEWNAN
Publisher: Oxford University Press
expand_more
expand_more
format_list_bulleted
Question

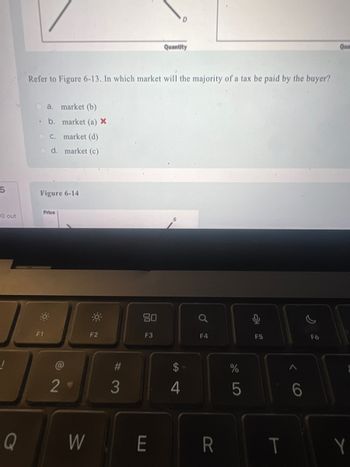
Transcribed Image Text:5
O out
!
Q
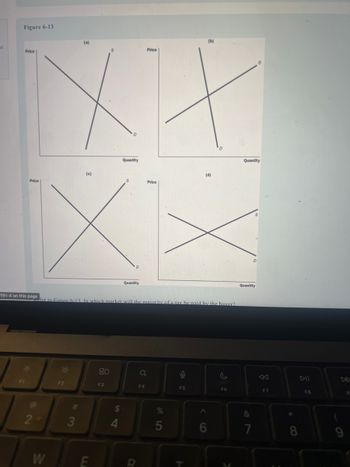
Refer to Figure 6-13. In which market will the majority of a tax be paid by the buyer?
a. market (b)
ob.
c. market (d)
Od. market (c)
market (a) *
Figure 6-14
Price
F1
2°
F2
#3
80
F3
W E
D
Quantity
4
Q
F4
R
%
5
F5
T
6
F6
Y

Transcribed Image Text:ut
Figure 6-13
Price
F1
Price
191-4 on this page
2
W
F2
#
(a)
3
(c)
E
80
fer to Figure 6-13. In which market will the maiority of a tax be paid by the buyer?
F3
Quantity
$
4
Quantity
R
Price
F4
Price
5
0
F5
(b)
(d)
6
D
F6
Quantity
D
Quantity
&
7
F7
8
DII
F8
Expert Solution
This question has been solved!
Explore an expertly crafted, step-by-step solution for a thorough understanding of key concepts.
Step by stepSolved in 3 steps

Knowledge Booster
Learn more about
Need a deep-dive on the concept behind this application? Look no further. Learn more about this topic, economics and related others by exploring similar questions and additional content below.Similar questions
- MSC $45 30 MC 25- 10 MB Q (Units of Lumber) 140 170 Above is a market for lumber. What is the amount of the tax that eliminates the inefficiency in this market? O $15 O $5 O $20 O $10arrow_forward6. The diagram below shows the market for chromebooks in the town of Smallville, U.S.A. Policy mak- ers want to collect money for more paper books in school and place a tax of 100 $ on chromebooks. Describe the impact of the tax on the market below. Price 500 450 400 350 300 250 200 150 100 50 100 200 300- Chromebooks 800 900 1,000 7. After the tax, 8. After the tax, consumers pay a price of . 9. After the tax, producers receive a price of 10. What amount of tax revenues are collected when the tax is instituted?. chromebooks are exchanged in the market.arrow_forwardWhich of the following is an example of a Tax Deduction? O Clothing Expenses O Child Dependency Expenses O Educational Expenses O Travel Expenses 1 3 4 Nextarrow_forward
- Consumer and Producer surplus Stax P $100 $70 $50 $45 $X $5 D 40 60 Assume an excise tax that has caused a decrease in Supply as shown on the graph above Show all work. а. How much is the tax per- unit b. How much is the value of X (intercept of the green line). How do you describe what that value is? C. How much is the consumer surplus before the tax? d. How much is producer surplus before the tax? е. How much is the consumer surplus after the tax? f. How much is producer surplus after the tax? g. How much is the deadweight loss as a result of the taxarrow_forwardO out Figure 8-3 Price Pa P₂ P₁ a. Pl . b. P2 X -Tax- C. P3 - P2 d. P3 Figure 21 D B 92 Refer to Figure 8-3. What is the price sellers receive after the tax? D Quantityarrow_forwardFigure 8-5 Price P3 P1 P₂ a. A C. B d. D F -Tax- G 92 C E P2 and Q2 o b. P2 and Q1 X P1 and Q1 P3 and Q2 H Refer to Figure 8-5. What is the price sellers receive after the tax and the quantity sold? 9₁₂ S Quantityarrow_forward
- Figure 4-15 Price (dollars per case) $32 27 22 20 0 Tax- 50 O $7. O $20. O $22. O $27. 90 Supply with tax Supply Quantity (thousands of cases) Figure 4-15 shows the market for beer. The government plans to impose a per-unit tax in this market. Refer to Figure 4-15. The price buyers pay after the tax isarrow_forwardThe vertical distance between points A and B represents a tax in the market. 22- Price 222 20 18- 16 14 12- 22 10 8 9 Supply Demand 100 200 300 400 500 600 700 800 900 1000 Quantity Refer to Figure 8-6. Total surplus with the tax in place isarrow_forwardRefer to imagearrow_forward
- Question 5 Suppose that the government imposes a tax on cigarettes. Use the diagram below to answer the questions. D is the demand curve before tax, S is the supply curve before tax and ST is the supply curve after the tax. Price 12 10 - Qua (a) For the market for cioarettes without the tax, Indicate: (0) Price paid by consumers Price paid by producers Quantity of cigarettes sold Buyer's reservation price Sellers reservation pricearrow_forwardFigure 8-5 Suppose that the government imposes a tax of P3 - P1. P4 P3 P2 Pl Price F. 4 CO OA. O F G D+H. 02 OC+H. 2 H I Q1 Refer to Figure 8-5. The tax causes a reduction in producer surplus that is represented by area Supply Demand Quantityarrow_forwardFirst, use the black point (plus symbol) to indicate the equilibrium price and quantity of designer handbags in the absence of a tax. Then use the green point (triangle symbol) to shade the area representing total consumer surplus (CS) at the equilibrium price. Next, use the purple point (diamond symbol) to shade the area representing total producer surplus (PS) at the equilibrium price. PRICE (Dollars per handbag) 500 450 400 Demand 350 300 250 200 Before Tax Supply 150 100 50 0 0 160 320 480 640 800 960 1120 1280 1440 1600 QUANTITY (Handbags) + Equilibrium Consumer Surplus Producer Surplus ?arrow_forward
arrow_back_ios
SEE MORE QUESTIONS
arrow_forward_ios
Recommended textbooks for you

 Principles of Economics (12th Edition)EconomicsISBN:9780134078779Author:Karl E. Case, Ray C. Fair, Sharon E. OsterPublisher:PEARSON
 Engineering Economy (17th Edition)EconomicsISBN:9780134870069Author:William G. Sullivan, Elin M. Wicks, C. Patrick KoellingPublisher:PEARSON
 Principles of Economics (MindTap Course List)EconomicsISBN:9781305585126Author:N. Gregory MankiwPublisher:Cengage Learning
 Managerial Economics: A Problem Solving ApproachEconomicsISBN:9781337106665Author:Luke M. Froeb, Brian T. McCann, Michael R. Ward, Mike ShorPublisher:Cengage Learning
 Managerial Economics & Business Strategy (Mcgraw-...EconomicsISBN:9781259290619Author:Michael Baye, Jeff PrincePublisher:McGraw-Hill Education


Principles of Economics (12th Edition)
Economics
ISBN:9780134078779
Author:Karl E. Case, Ray C. Fair, Sharon E. Oster
Publisher:PEARSON

Engineering Economy (17th Edition)
Economics
ISBN:9780134870069
Author:William G. Sullivan, Elin M. Wicks, C. Patrick Koelling
Publisher:PEARSON

Principles of Economics (MindTap Course List)
Economics
ISBN:9781305585126
Author:N. Gregory Mankiw
Publisher:Cengage Learning

Managerial Economics: A Problem Solving Approach
Economics
ISBN:9781337106665
Author:Luke M. Froeb, Brian T. McCann, Michael R. Ward, Mike Shor
Publisher:Cengage Learning

Managerial Economics & Business Strategy (Mcgraw-...
Economics
ISBN:9781259290619
Author:Michael Baye, Jeff Prince
Publisher:McGraw-Hill Education